Your complete guide to the latest trends in digital behaviour around the world.
Kepios founder Simon Kemp takes us through the key headlines featured in our Digital 2023 October Global Statshot.
Growth in many key digital metrics is actually accelerating
We’re almost at the end of another year, but the pace of digital change doesn’t appear to be slowing as we head towards 2024.
In fact, our new Digital 2023 October Global Statshot Report – published in partnership between Meltwater and We Are Social – shows that growth in many key digital metrics is actually accelerating.
That wasn’t what I was expecting to see this quarter, but that’s the very reason we produce these Global Digital Reports: to go beyond assumptions, and discover new truths.
And this final round of updates for 2023 reveals a wealth of important headlines and trends, including:
A huge new milestone for Facebook;
A change in direction for the time we spend online;
Essential insights into trends in social media referrals;
Some surprising stats on enduring behaviours and preferences;
A compelling collection of headlines for TikTok;
A big jump in Instagram reach – but with a caveat;
New milestones for Telegram, Pinterest, and Quora;
The outlook for digital in 2024 and beyond.
That’s just a brief taster of this quarter’s content though; our full October report is packed with more than 300 slides exploring what people are really doing on the internet, social media, mobile devices, and online shopping platforms.
Definitive digital data
In addition to thanking We Are Social and Meltwater for making these reports possible, I’d like to start by offering my heartfelt thanks our wonderful data partners, without whom the Global Digital Reports series would be a lot less informative:
Just before we explore this quarter’s data, note that we continue to see incongruous trends in the data published in the ad tools of various social platforms. We’ll explore some of these anomalies below, but please exercise caution when analysing trends in social media audience data.
Top takeaways
If you need fast insights, the video below distills all of this quarter’s top headlines and trends.
Once you’ve watched that, scroll down for the full report.
The complete Digital 2023 October Global Statshot Report
You’ll find this quarter’s complete report in the embed below (click here if that’s not working for you), but read on past that to explore our in-depth analysis of what all these numbers actually mean.
The state of digital in October 2023
As always, let’s start with the latest headlines for digital adoption and use around the world:
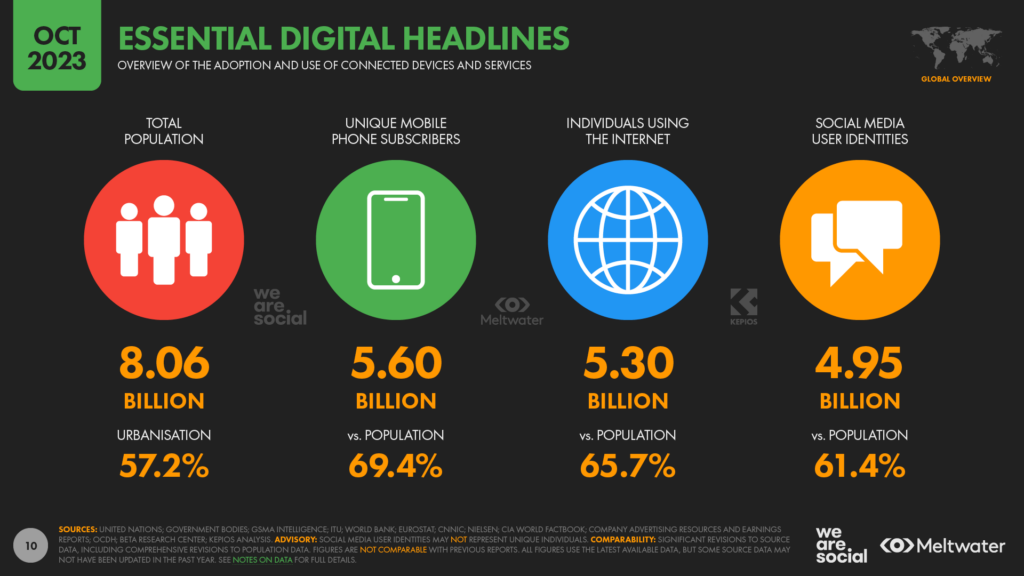
The United Nations’ latest population figures show that there are 8.06 billion people living on Earth in October 2023. That figure is just under 1 percent higher than the equivalent figure for the same time last year, with the world’s population growing by 72 million over the past 12 months.
The latest insights from GSMA Intelligence point to a total of 5.60 billion unique mobile subscribers around the world today, which equates to 69.4 percent of the total population. Mobile phone adoption increased by 2.7 percent over the past year, with the addition of 145 million new users.
Internet user figures have grown by 3.7 percent over the past year, to reach 5.30 billion in October 2023. This figure equates to 65.7 percent of the world’s population, although delays in reporting mean that actual internet penetration is likely higher than these figures suggest.
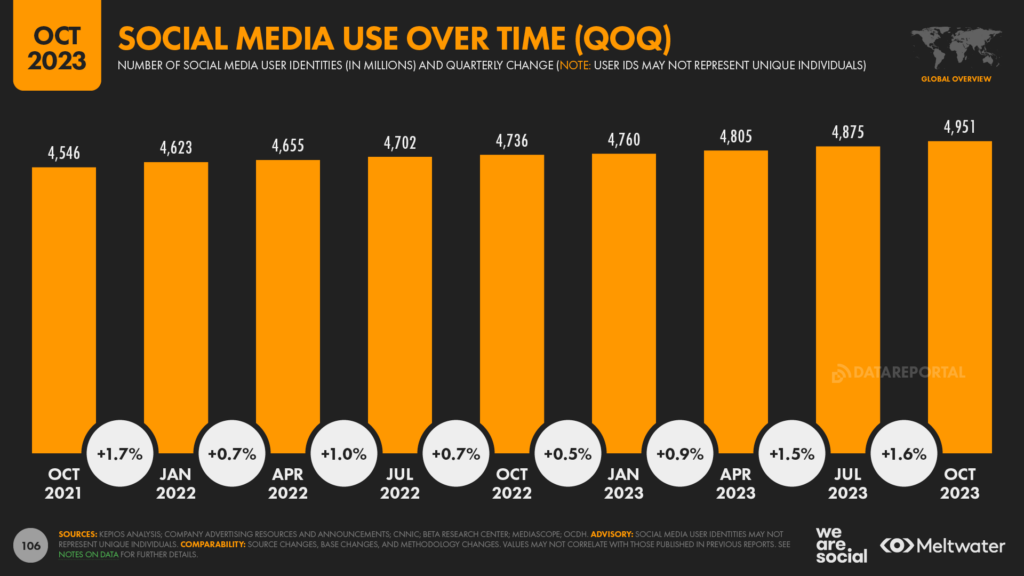
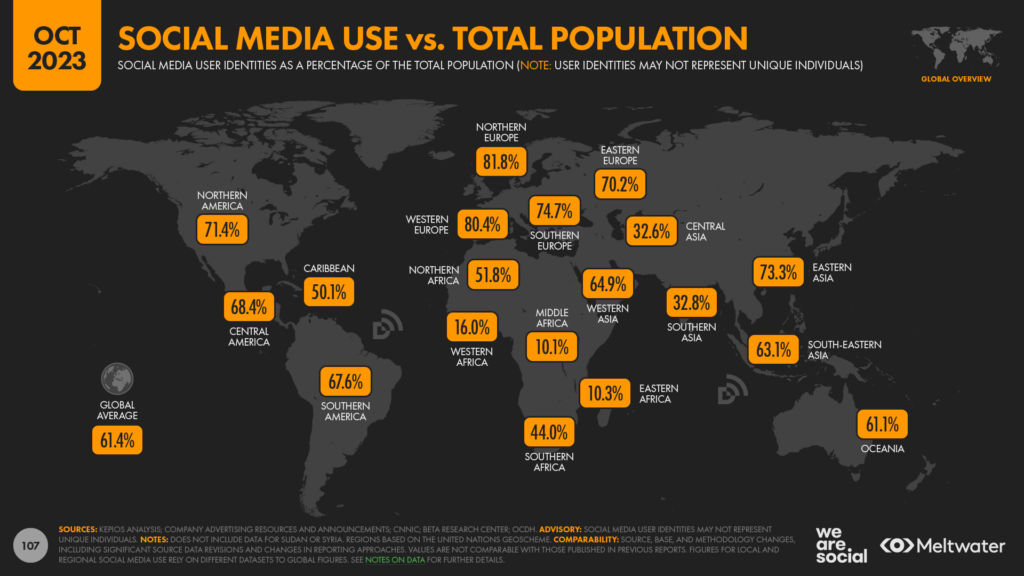
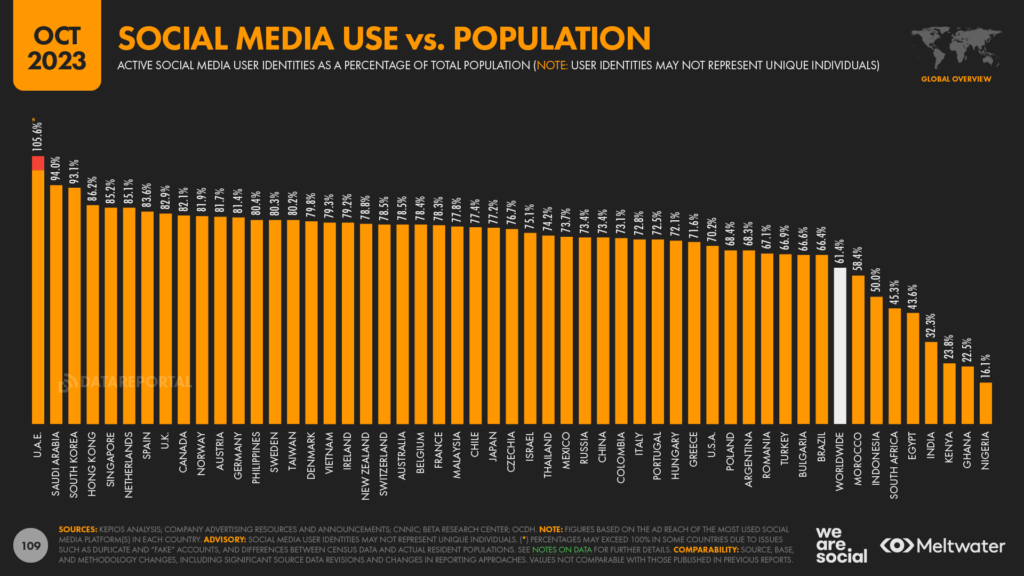
Kepios analysis shows that active social media user identities had grown to 4.95 billion by the start of October 2023, equating to 61.4 percent of the world’s total population. Active identities have increased by 4.5 percent since this time last year, thanks to the addition of 215 million new users.
That’s a great high-level view of the current “state of digital”, but what does the data tell us about people’s evolving behaviours?
Read on to find out…
Online time rebounds
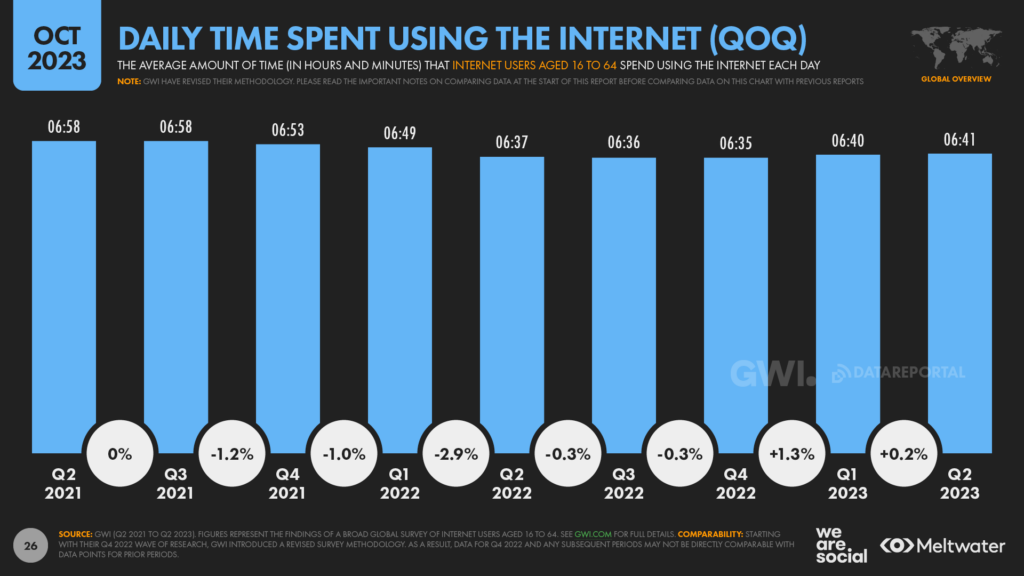
Following the declines that we explored in some detail at the start of 2023, the amount of time that people spend using the internet has started to creep back up again over recent months.
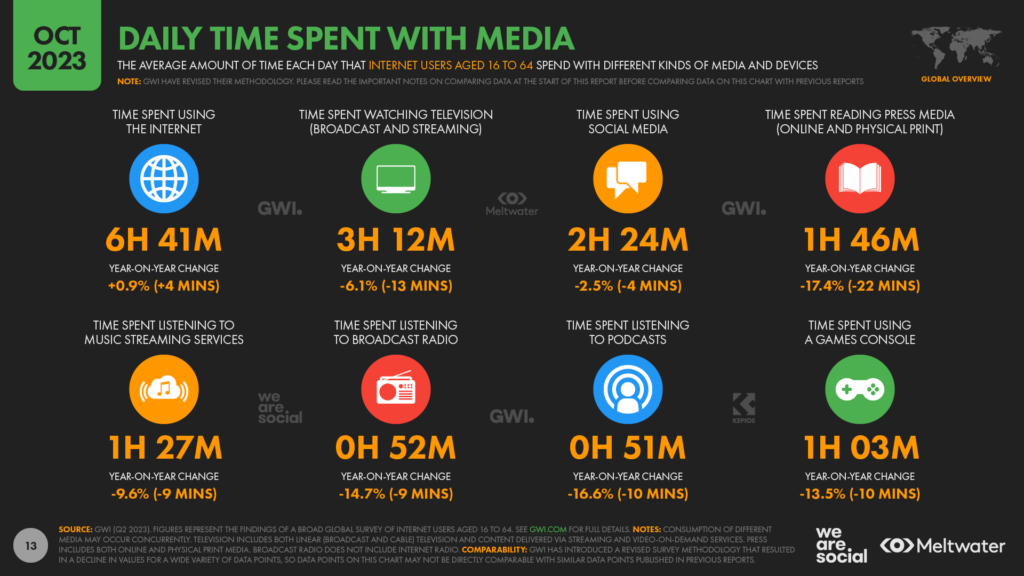
The latest data from GWI shows that the typical internet user has increased their online activity by 4 minutes per day over the past 12 months, and by 6 minutes per day versus the lowest of the most recent lows that we saw 6 months ago.
However, that 4 minute increase in daily internet activity equates to a relative increase of less than 1 percent, and the amount of time that we spend online is still well below the elevated levels of activity that we saw in early 2021.
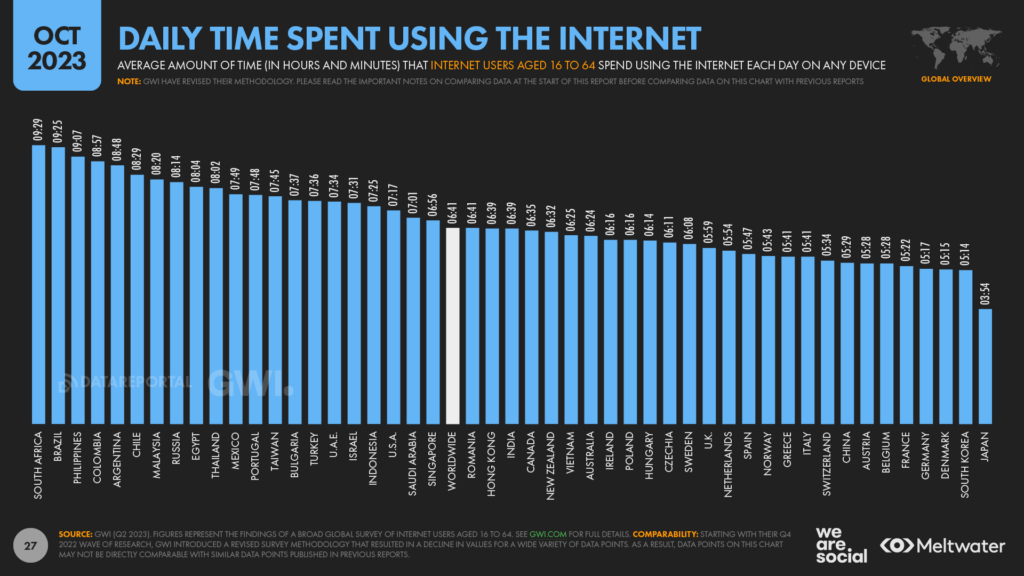
But – as we see so often with internet behaviours – the data still shows significant differences in internet activity around the world.
GWI’s research reveals that South Africans spend the greatest amount of time online, with the “typical” user in the country now spending roughly 9½ hours per day using connected devices and services.
Brazil comes in a close second, with the country’s netizens averaging 9 hours and 25 hours per day, while Filipinos rank third, at 9 hours and 7 minutes per day.
Japan still sits at the opposite end of the spectrum though, with the country’s internauts spending an average of less than 4 hours per day online.
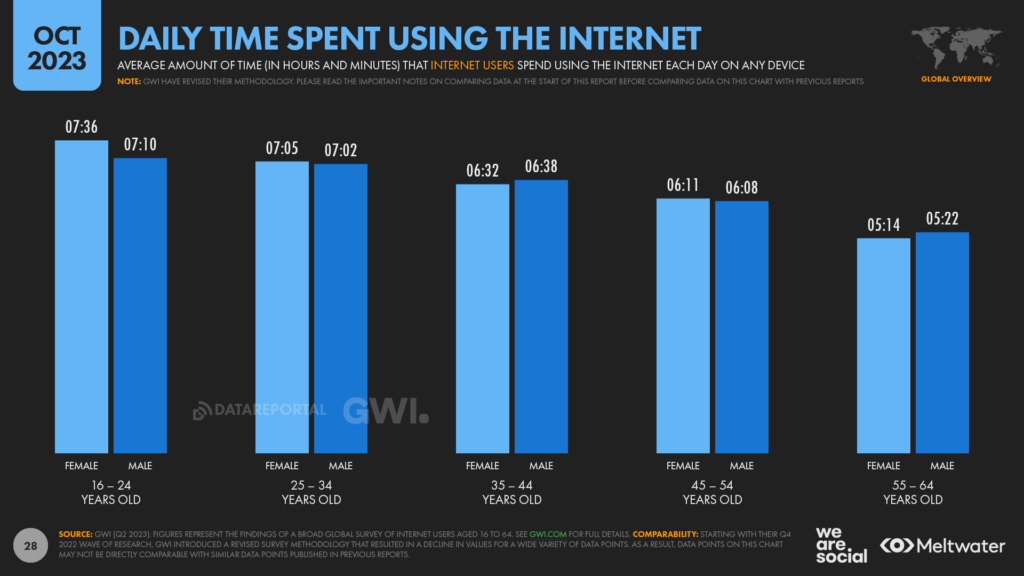
Culture likely plays an important part in shaping this ranking, but the median age of the population is also a key factor.
Overall, average daily internet time tends to decrease with age, which may explain why Japan sits at the bottom end of this ranking.
TV time slips
Meanwhile, the amount of time that people spend watching TV content has actually declined over recent months.
GWI’s latest survey data suggests that internet users have reduced their TV watch time by 13 minutes over the past year, resulting in a relative 6.1 percent drop in the time spent consuming content across streaming and broadcast TV.
GWI’s data also shows declines across various online activities though, so this doesn’t appear to be a case of the internet stealing TV’s dinner.
And with overall internet time increasing by just 4 minutes per day during the same period, it’s tricky to identify exactly where that remaining “TV time” has gone.
Overall, the data suggests that people may have reduced their total, combined media time by roughly 10 minutes per day compared with this time last year, which would indicate a reduction of more than an hour of media time per week.
However, it’s worth highlighting that GWI’s research points to significant “overlaps” in our media activities (e.g. scrolling social feeds at the same time as watching TV), so this may simply be the result of people being more focused on one media activity at a time, rather than multitasking.
Social adoption growing steadily
Social media users continue to grow at the faster pace we saw in our July 2023 data, and Kepios analysis reveals that user growth actually accelerated further during Q3.
Active user identities increased by 1.6 percent over the past three months, with an additional 76 million active users pushing the global total up to 4.95 billion by the start of October 2023.For perspective, that means social media adoption has grown at an average rate of 9.6 users per second over the past 90 days.
Encouragingly, much of that growth has been fuelled by increased adoption across Africa, and the latest data reveal that social media adoption now exceeds 10 percent in every global region.
However, our latest numbers still point to low levels of active social media use across much of Sub Saharan Africa, with adoption only just above 10 percent in Middle and Eastern Africa.
Meanwhile, at the other end of the spectrum, adoption data has started to show some rather improbable trends.
For reference, we take the potential audience reach figure reported by the social media platform with the largest active user base in any given country as the basis for our “active user identities” number in that country.
In the case of the United Arab Emirates, this is now TikTok, which reports total ad reach of more than 10 million users in the country.
However, the latest data from the United Nations puts the UAE’s total population at just 9.5 million, resulting in a social media “adoption” figure that exceeds 100 percent.
As we stress throughout our reports though, our “active user identities” figures do not represent unique individuals, and these social media adoption figures may be distorted by factors such as duplicate and “false” accounts, user age misstatements, and differences between census data and actual resident populations.
And this last factor may be particularly relevant to the figures for the UAE.
Expatriates account for roughly 90 percent of the country’s resident population, and this may mean that resident figures fluctuate meaningfully over time, even for relatively short periods.So, while “adoption” figures in excess of 100 percent may look incongruous, the figures may not actually be incorrect.
A third of online time is spent on social
The mainstream media still seems to love churning out clickbait proclaiming that “social media is dead”, but if you’re starting to believe the headlines, we have news for you: it’s not.
As we’ve just seen, social media users continue to grow, and people are still spending roughly 2½ hours per day using social platforms.
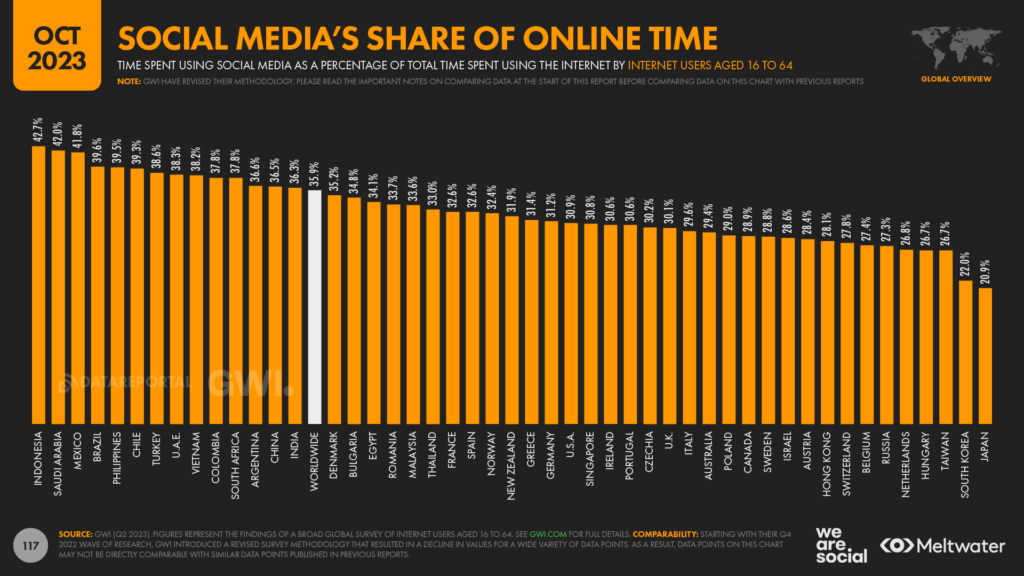
Yes, average social media time has declined by a few minutes per day over the past year, but the typical working-age internet user still allocates more than one-third of their total online time (35.9 percent) to social media activities.
Moreover, people are still using a wide variety of social platforms, with GWI’s data pointing to an average of 6.7 platforms per user, per month.
However, as we’ll see below, our platform habits and preferences have seen some meaningful changes over recent months.
Social media referrals
There has been plenty of buzz over recent weeks about a Similarweb study that revealed a massive drop in social media referral traffic to news websites.
The impact seems to vary by news outlet, but the overall take-away from Similarweb’s analysis is that top news sites have seen social media referrals fall by more than 60 percent.
For top publishers like The New York Times, The Guardian, and Yahoo! News, these declines translate into millions of “lost” visits.
And that’s a particularly important problem for news brands, because many of these outlets still rely heavily on traffic for ad revenue – even if some business models have changed markedly over recent years.
Reports suggest that changes to algorithms and policies at Facebook and X (formerly Twitter) have been the biggest factor driving social media referrals declines, partly because these platforms are responsible for an outsized share of news content and traffic compared with other social media sites (see our Digital 2023 July Global Statshot Report for more details).
But are social media platforms really “throttling” traffic to news sites?
Let’s dig deeper.
Declining traffic in context
Similarweb data shows that overall traffic to the New York Times’s website has declined by roughly a third over the past 18 months, from more than 870 million total visits in April 2022, to 570 million visits in September 2023.
Meanwhile, the year-on-year decline – i.e. total traffic in September 2023 vs. September 2022 – was close to 50 percent.
More specifically, traffic to the New York Times’s website that could be attributed to social media referrals fell from 77 million visits in April 2022, to 31 million visits in September 2022.
That means social media referrals’ share of total New York Times traffic fell from 8.8 percent in April 2022, to just 5.4 percent in September 2023.
And it’s a similar story for the Guardian.
Similarweb’s data reveals that social media referrals’ contribution to the Guardian’s total web traffic fell from 15 percent in April 2022, to just 10 percent in September 2023.
But it’s not just traffic to news websites that has fallen over recent months.
Usage insights from data.ai reveal that – worldwide – active users of the New York Times’s various apps across iOS and Android devices also declined by roughly a quarter between April 2022 and September 2023.
Similarly, global active users of the Guardian’s various apps fell by roughly a fifth during the same period.
And the key takeaway here is that overall traffic and usage appears to have declined – not just traffic from social media referrals.
So are these declines really the result of changes in social media companies’ policies and algorithms, or might they be the result of broader changes in organic user behaviour?
Cause or effect?
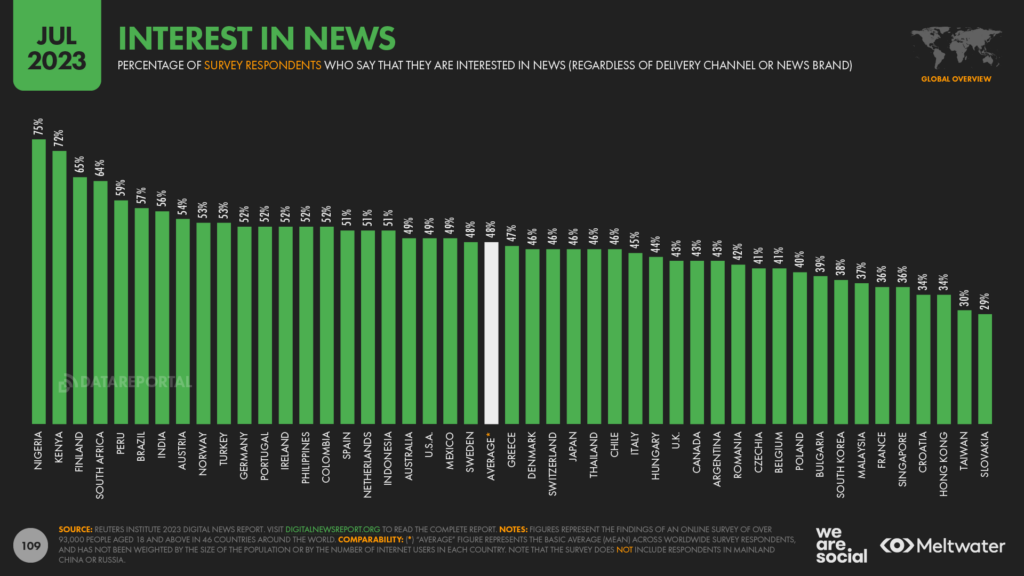
Well, for perspective – as we reported in our Digital 2023 July Global Statshot Report – worldwide interest in news has been declining steadily over recent years.
Indeed, the ever-excellent Reuters Digital News Report reveals that the number of adults who are either “very” or “extremely” interested in news has fallen by a quarter over the past seven years, from 63 percent in 2017, to just 48 percent in 2023.
And furthermore, interest in news declined at its fastest rate in five years over the past twelve months, from 51 percent in 2022, to this year’s 48 percent.
However, while declining interest in news may have played a role in the broader declines we explored above, the relative decline in interest isn’t enough to explain the overall decline in traffic to news websites and app activity.
In other words, it would appear that changes in social media policies and algorithms have indeed played a part in the declining fortunes of some of the world’s top news brands.
But does this trend only impact news sites, or have other industries also seen a decline in social media referrals?
Social media as a traffic driver
It’s tricky to offer a definitive answer to that question, because traffic trends vary from country to country and industry to industry.
However, in order to make better sense of these trends, Kepios has examined web traffic data for more than 100 of the world’s top consumer brands on the web, using data published by Semrush.
And overall, this data suggests that consumer brands have indeed seen referrals from organic social media posts decline over the past 12 months, although the story is more complex than this headline suggests.
Of the 110 brands we studied, 6 in 10 (60.4 percent) saw social media referrals decline as a share of their overall web traffic.
Meanwhile, an even greater share of the brands in our study – 62.8 percent – also saw a decline in total traffic volumes generated by organic social media referrals since this time last year.
However, when we explore average values, some different perspectives emerge.
Across all of the brands we studied, the mean relative share of web traffic attributable to social media referrals actually increased over the past year, by 4.4 percent.
However, this figure has been skewed by a handful of large outliers, and in fact, the median change in traffic share attributable to organic social media referrals over the past 12 months was a decline of 19.6 percent.
Organic social referrals have declined
So, based on the data in our study, we believe that organic social media referrals have indeed declined for consumer brands in most industries, and not just for large news brands.
But it’s important to note that there’s nothing in this data to tell us whether brands have simply reduced their organic social media activity over the past year.
And similarly, changing user behaviours may also have played a role in these trends.
For example, people have been spending an increasing share of their social media time using TikTok over recent months, and external links are a far less prominent feature of the TikTok environment compared with platforms like Facebook and X (Twitter).
As a result, declines in organic referral traffic are unlikely to be the result of changes in social media algorithms alone.
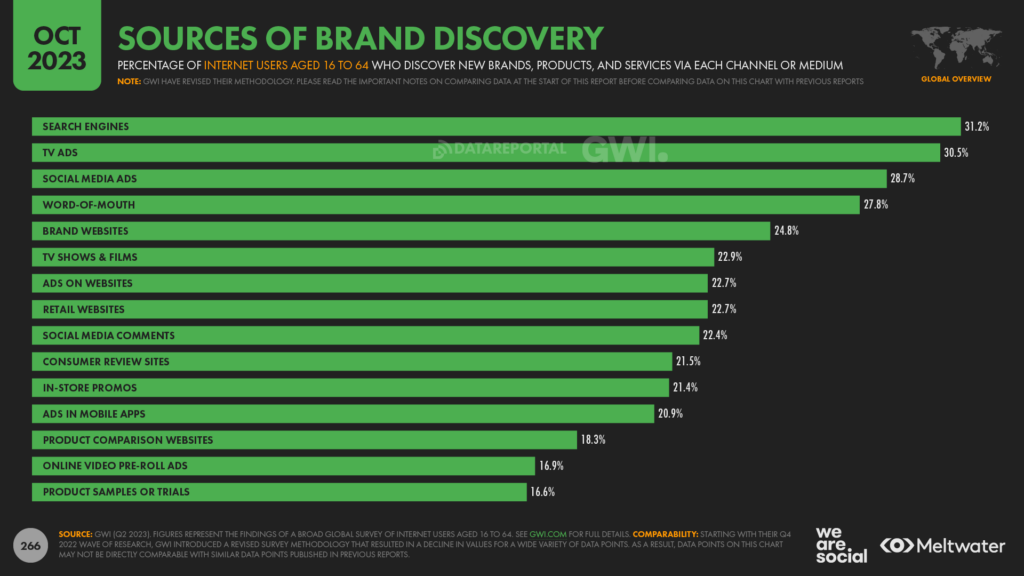
It’s also critical to stress that – across the 110 brands in our study – more than 100 of them had seen an increase in paid social media referrals, highlighting the fact that social media overall remains an important opportunity for brands.
And that’s reinforced by the latest data from GWI (see chart below), which reveals that paid social media placements are now the third most important source of brand discovery for the world’s working-age internet users.
A closer look at “organic” social
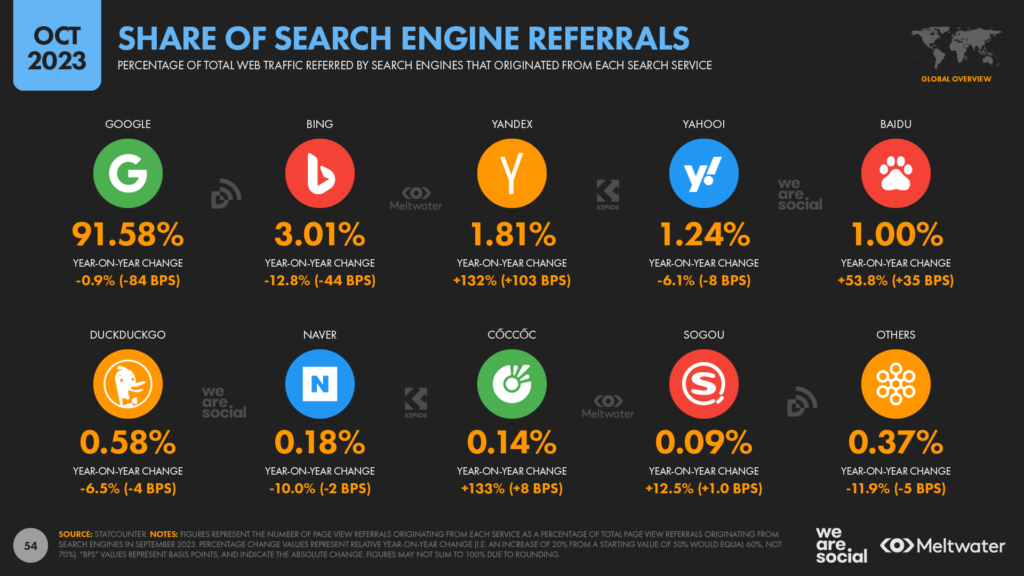
But – given the trends we’ve just explored – where might organic social fit in your mix? For context, analysis from Statcounter shows that DuckDuckGo accounted for just 0.58 percent of the global search market in September 2023.
However, despite that tiny share, data from Semrush shows that DuckDuckGo was still responsible for sending more traffic to amazon.com last month than organic referrals from all social media platforms combined.
Meanwhile, visitors to uniqlo.com were more likely to arrive on the site after clicking a link in an email than they were to have clicked on links shared organically in social media platforms.
And despite being one of X (Twitter)’s most discussed brands, visitors were more likely to arrive on apple.com via a Yahoo! search last month than they were to have clicked on an organic link shared on X.
But if you thought those stats were bad…
The performance of link posts
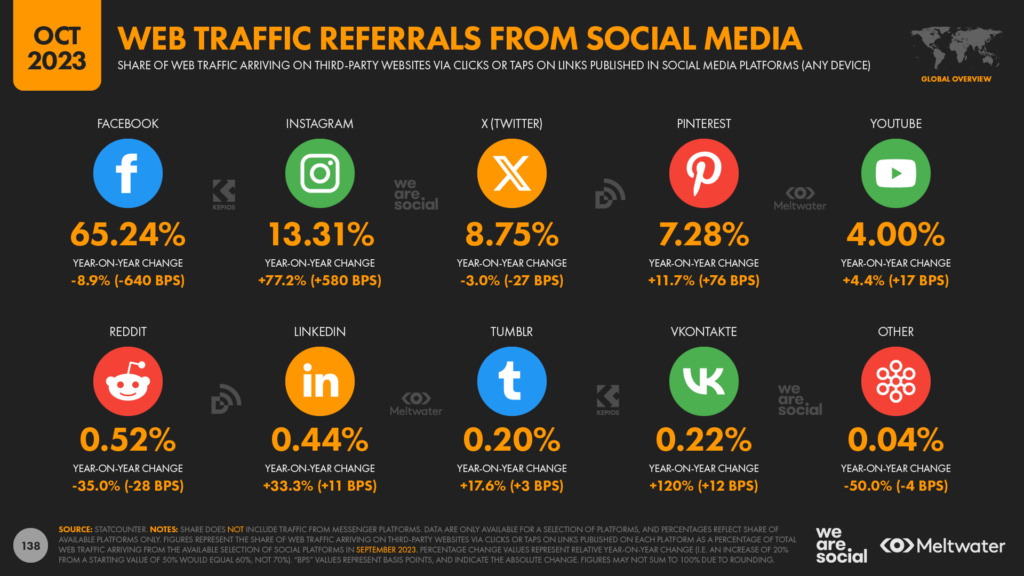
Overall, Statcounter data suggests that Facebook still accounts for the greatest share of social media referrals to third-party websites, delivering close to two-thirds of the global total.
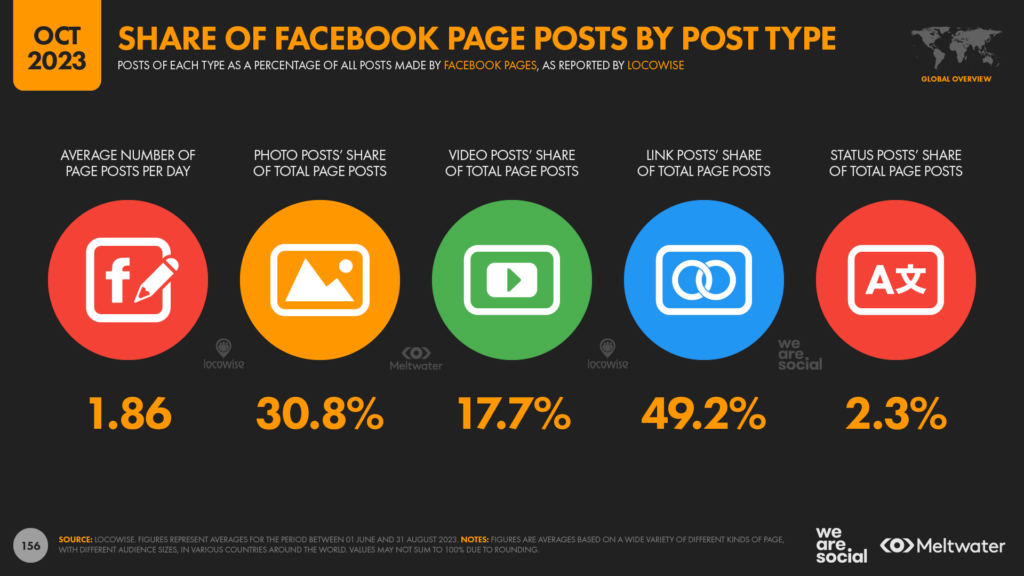
Meanwhile, analysis from Locowise suggests that “link posts” accounted for roughly half (49.2 percent) of the posts made by Facebook Pages between June and August 2023.
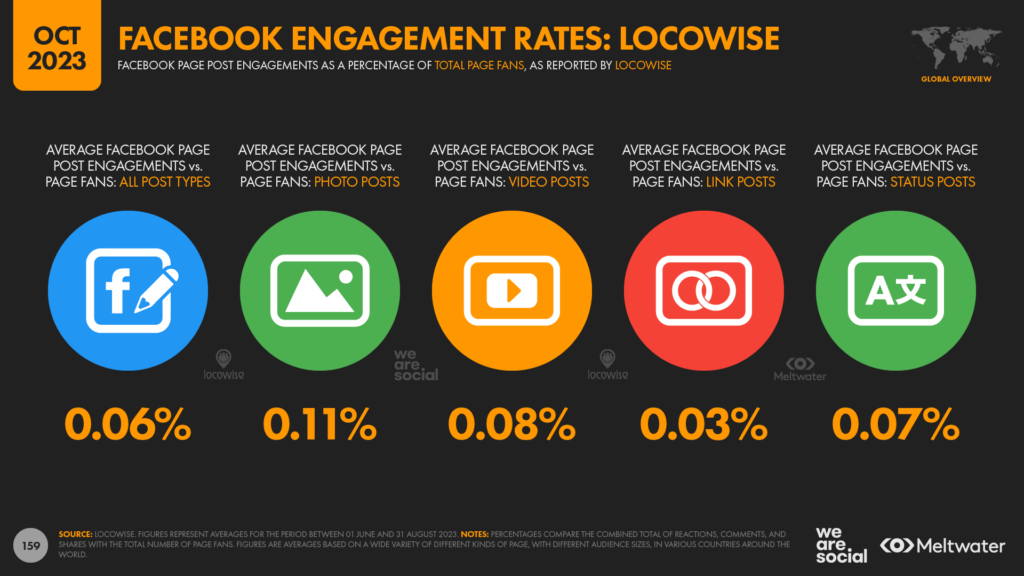
However, data from both Locowise and SocialInsider shows that these link posts generate the lowest levels of engagement of any post type on Facebook.
Locowise’s data indicates that Facebook Pages can only expect 3 in every 10,000 of their “fans” to engage with a link post – just 0.03% – reinforcing the hypothesis that “link posts” perform particularly poorly in Facebook’s post-ranking algorithm.
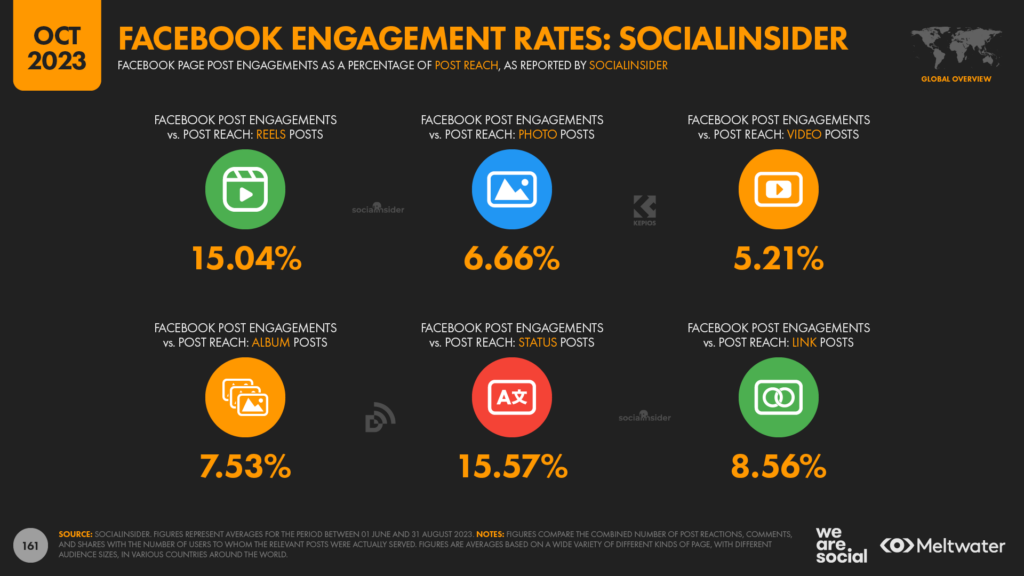
SocialInsider’s data offers some slightly more encouraging figures, with the company’s analysis indicating that roughly 8½ percent of Facebook users who actually see a link post from a Page will engage with it.
This compares with an average engagement rate of 5.2 percent for video posts, and 6.7 percent for photo posts, based on the number of users to whom those posts were actually shown.
However, it’s widely believed that link posts are penalised by Facebook’s algorithm because of the likelihood they’ll take users away from the platform, so it’s worth remembering that higher engagement rates for link posts will almost certainly be offset by lower potential reach.
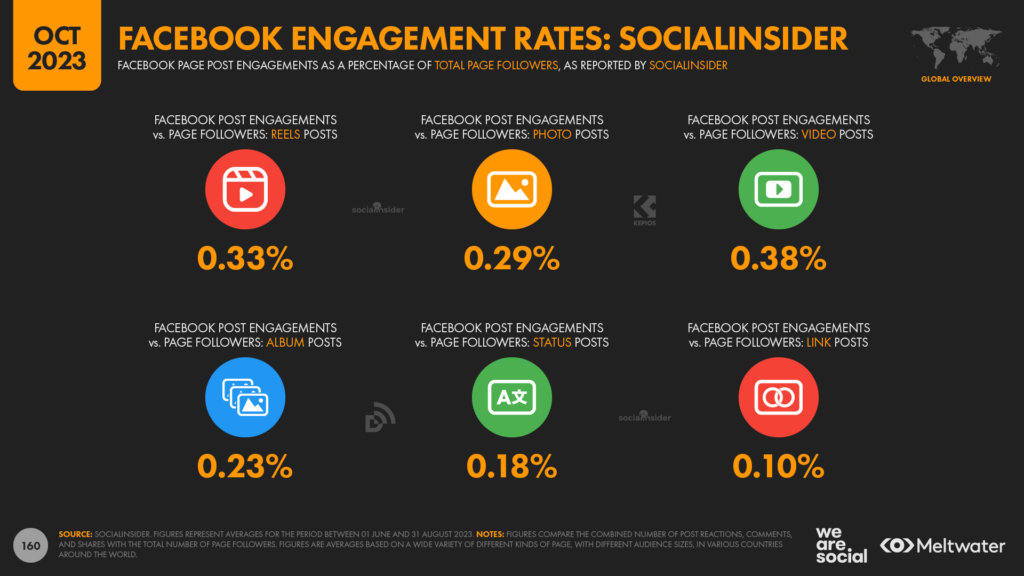
And there’s plenty of evidence to support that hypothesis in SocialInsider’s data for engagement rates based on Page followers instead of post reach.
The company’s analysis reveals that link posts only deliver an average of 0.10 percent engagement, which is barely half the average that we see across all post types of (0.22 percent).
And Locowise’s data reveals similar findings, with link posts delivering an average of just 0.03 percent engagement, compared to an overall average of 0.06 percent.
The bigger they come…
But that’s not all…
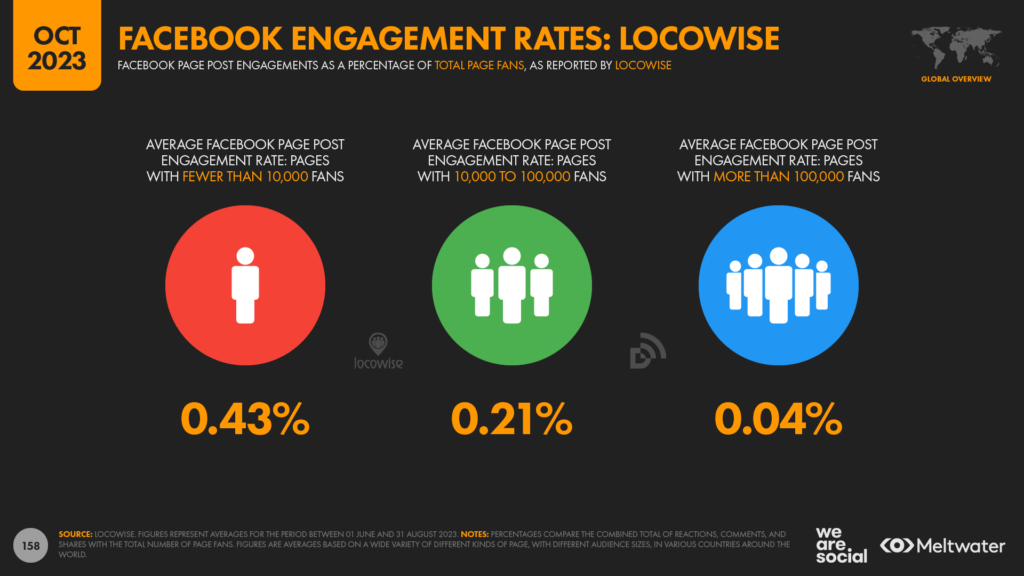
To make matters worse, these engagement rates deteriorate as a Page’s audience grows.
Locowise’s analysis suggests that, on average, a Facebook page with a million followers can only expect 400 users to engage with any of its posts, regardless of the post type.
That’s just 1 in every 2,500 followers.
For comparison, you’re 5 times more likely to have been born with 11 or morefingers or toes than you are to engage with an organic post published by a large Facebook Page.
And remember, that rate includes any form of engagement, on any kind of post – not just clicks that drive traffic to your website.
So, the takeaway for marketers from all of this data is clear: if you want to drive traffic to your website, you simply can’t rely on organic social media posts.
You’ll either need to pay to promote your links on social media, or you’ll need to use a different channel.
This takeaway relates specifically to using organic social media posts to drive traffic to third-party websites though, and there are various other objectives for which organic social media posts may still be wholly appropriate.
Moreover, as I stated above, paid social media posts appear to be an increasingly compelling option for marketing.
Computer access slipping
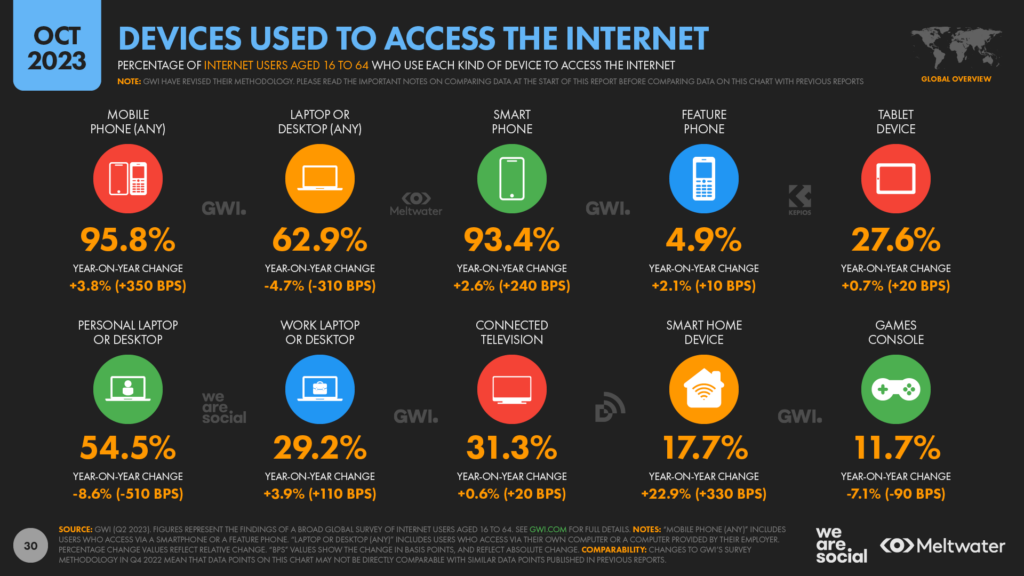
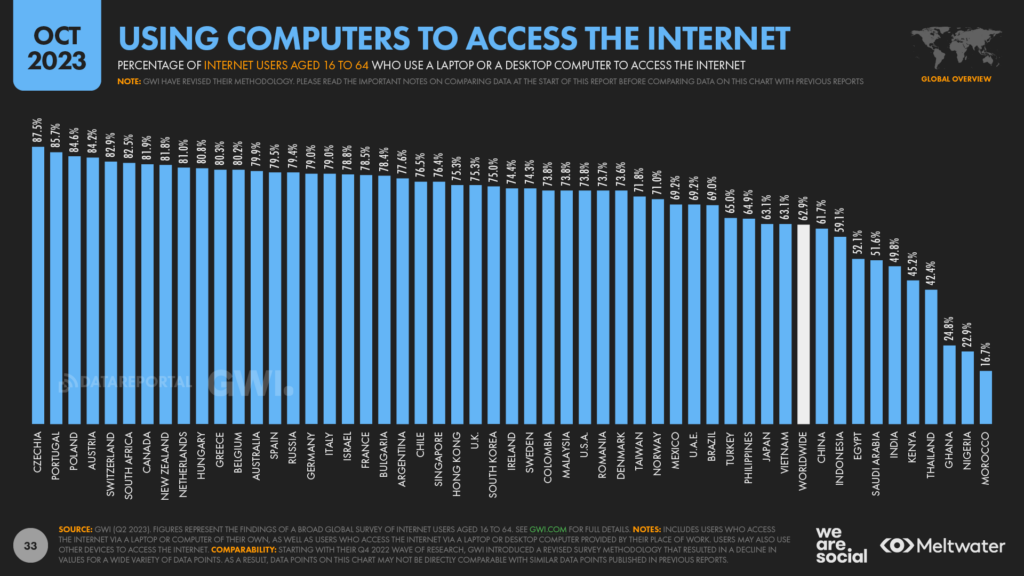
The number of working-age internet users who go online via laptop and desktop computers continues to decline.
New numbers from GWI reveal that fewer than 2 in 3 internet users between the ages of 16 and 64 now use these devices to access the internet, with that figure declining by a relative 4.7 percent (3.1 percentage points) over the past 12 months.
There’s been a particularly sharp decline in the use of computers that are owned by the individual who’s actually using them, with GWI’s data showing a year-on-year drop of 8.6 percent (-5.1 percentage points).
But conversely, use of work laptops and desktops has actually increased slightly, with internet access via these devices up by 3.9 percent (+1.1 percentage points) since this time last year.
For perspective, this decline in the use of computers is broadly in line with the increase in the use of phones to access the internet, with the latest research showing that mobile access has increased by 3.8 percent (+3.5 percentage points) over the past 12 months.
But despite these trends, it’s important to highlight that well over 6 in 10 working-age internet users still use computers for at least some of their online activities.
Below-average use of computers in India and China also skews the global picture, especially because these two countries currently account for more than 1 in 3 of the world’s internet users.
For example, GWI’s data reveals that three-quarters of internet users still use computers to go online across Europe and Northern America, while more than 7 in 10 users across Latin America also use computers to access the web at least some of the time.
But what does “some of the time” look like?
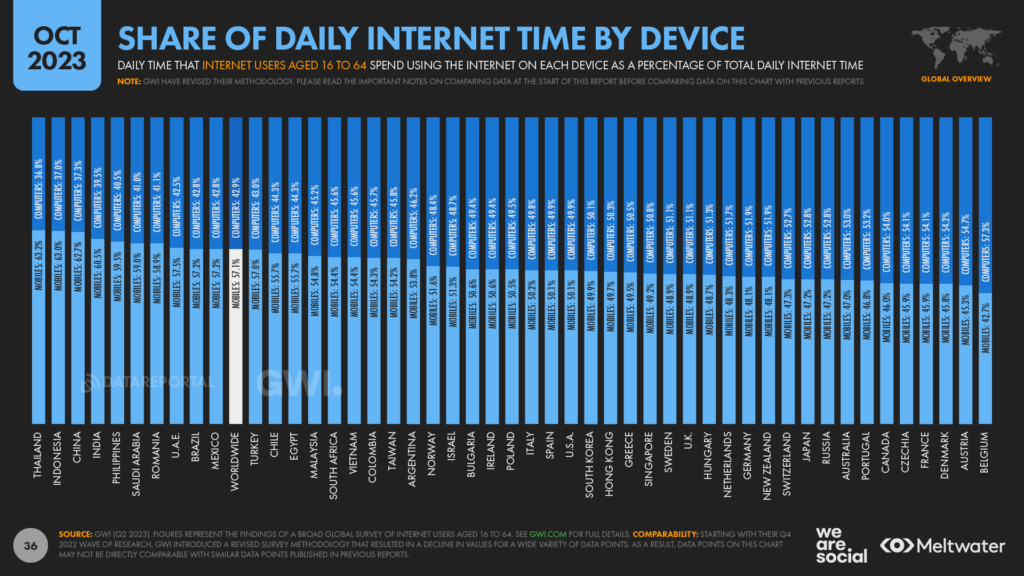
Well, once again, the picture varies by location.
Thais spend the greatest share of their online time on mobile phones, with handheld devices accounting for roughly 63 percent of daily internet activity.
But even then, computers and tablets still account for more than 1 in 3 online minutes in Thailand.
At the other end of the spectrum, Belgians spend the greatest share of online time using computers and tablets, with these larger-screen devices accounting for more than 57 percent of online activity.
Overall, slightly over 57 percent of the world’s total internet time can be attributed to mobile phones, but that means that computers and tablets are still responsible for well over 4 in 10 of our connected minutes.
So, the takeaway here is to pay close attention to your analytics data, to see whether different devices play different roles at different stages in your audience’s “journey”.
For example, you may find that mobile phones account for a greater share of traffic to web pages that cater primarily to new customers, whereas pages that require a greater degree of user input may see a higher share of traffic from computers.
These trends will likely vary considerably from industry to industry and brand to brand though, so my advice would be to spend some time exploring your own site’s analytics, and to look for things that surprise you.
Websites are still winners
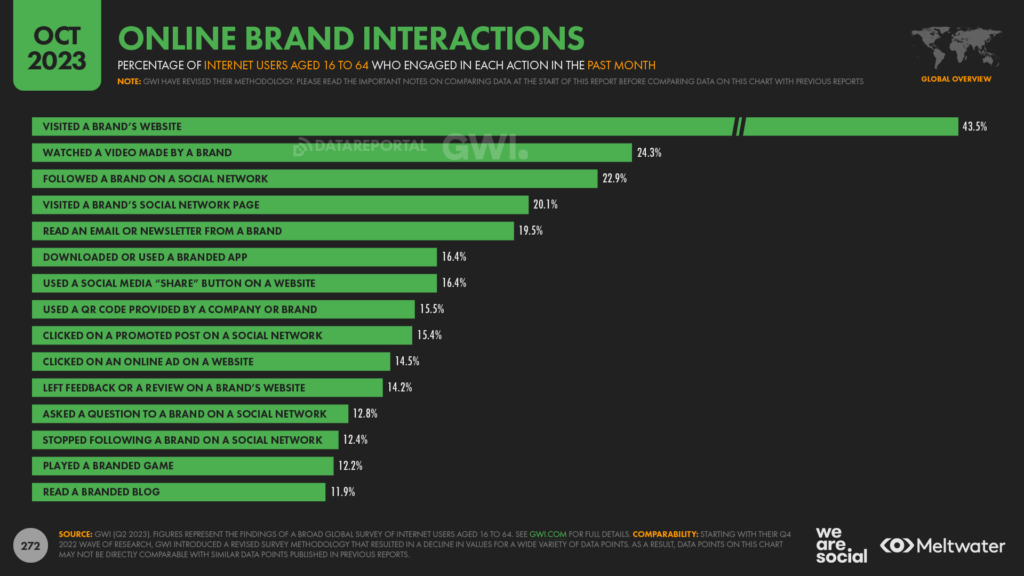
Staying on the subject of web traffic, new research indicates that websites should still play a central role in brands’ online marketing activities.
They may not sit at the top of the marketing “hype cycle”, but more than 4 in 10 working-age internet users say that they have visited a brand’s website in the past month, putting these properties far ahead of any other source of online brand engagement.
And don’t be fooled by stereotypes either; younger people are just as likely to visit brand websites as older generations are.
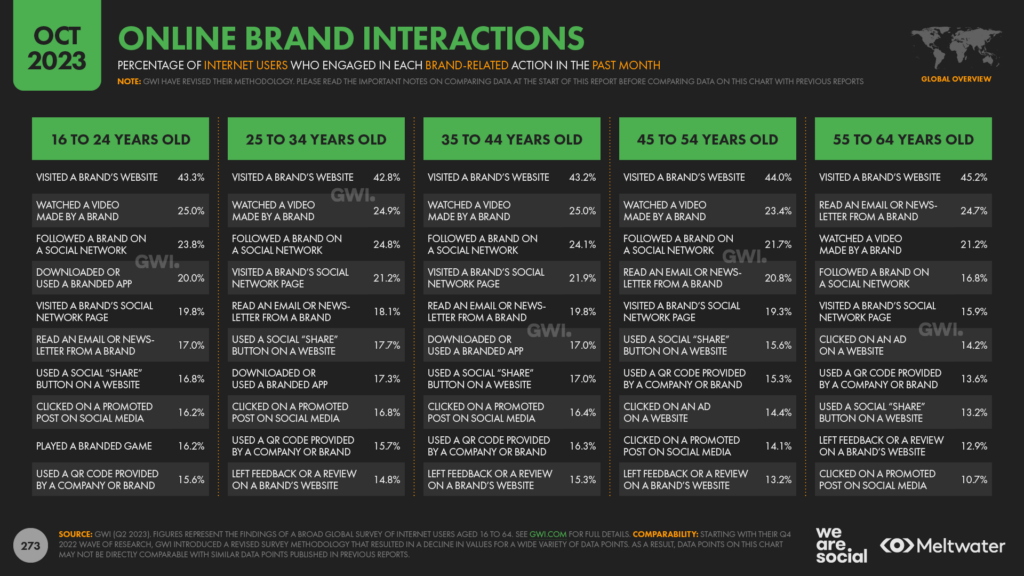
Indeed, at a worldwide level, websites top the list of brand-related actions across all age groups in GWI’s survey.
And what’s more, the importance of websites versus other brand-related actions is just as clear amongst internet users aged 16 to 24 as it is amongst users aged 55 to 64.
For example, 43.3 percent of that younger age group say they visited a brand website in the past month.
Meanwhile, just 25 percent of this age group say that they watched a video made by a brand in the past month, meaning that these younger users are more than 70 percent more likely to visit a brand’s website than they are to engage in any other online interaction with a brand.
And a similar story plays out across all age groups.
Amongst people aged 55 to 64, 45.2 percent say that they visited a brand’s website in the past month, compared with 24.7 percent who say that they read an email or newsletter from a brand, which ranked second.
The data also reveals that following brands on social media and visiting brand’s social media profiles are still important activities across all age groups too.
However, this data highlights that all of these marketing activities are valuable opportunities to engage audiences, and marketers should not treat them as a binary, “either / or” choices.
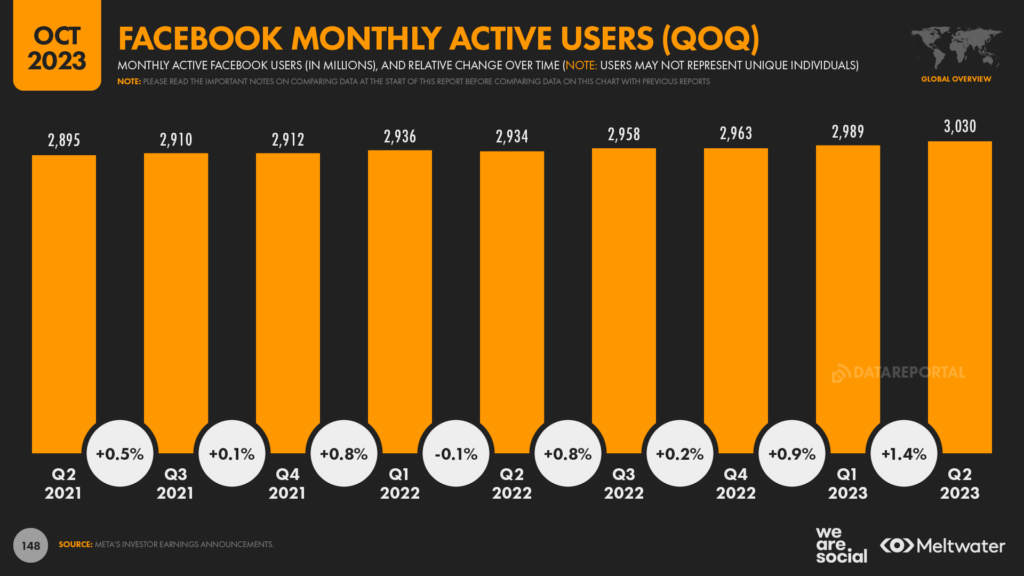
3 billion people now use Facebook each month
Still think “Facebook is dead”? Think again.
Figures revealed in Meta’s most recent 2023 Q2 investor earnings report show that 3.03 billion accounts now use Facebook every month.
For context, these figures suggest that 37.6 percent of the world’s total population uses Facebook each month.
However, Facebook limits access to people aged 13 and above, and the platform remains blocked in China, so it’s perhaps more appropriate to report that 59.6 percent of audiences who can use Facebook already do.
Just let that sink in for a moment: almost 6 in 10 people who are able to use Facebook now use it every month.
Moreover, regardless of their age or location, more than two-thirds of the world’s total internet user base now accesses Facebook each month.
Whatever the media may say, that’s an incredible achievement.
Facebook use in perspective
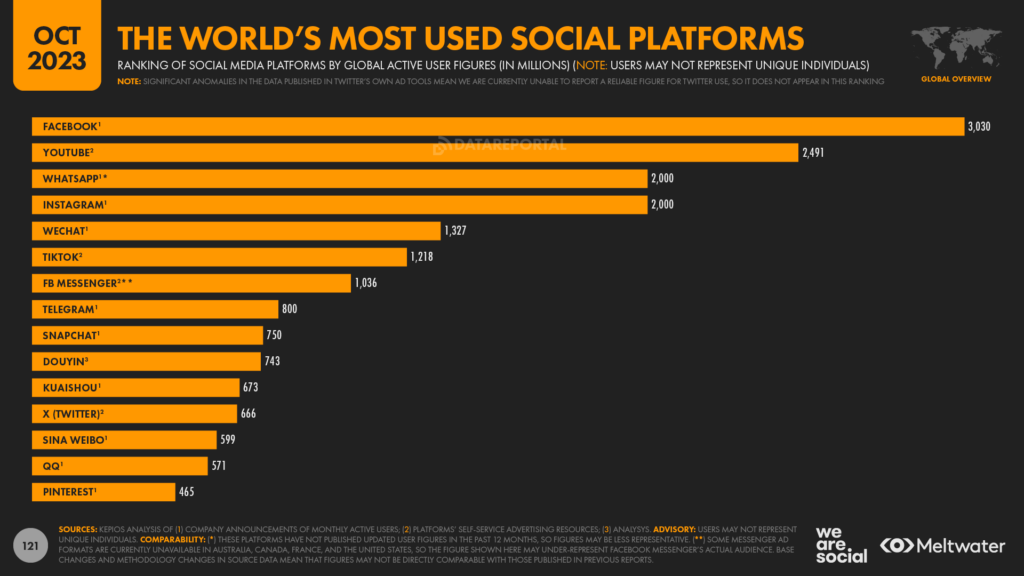
Facebook is the first platform to claim it has passed the 3 billion user milestone, and “official” platform figures indicate that Facebook may still be a long way ahead of its next nearest rival too.
However, it’s important to stress that the YouTube ad reach figure that we include in our platform ranking chart likely undercounts overall YouTube use by a significant margin.
For comparison, Facebook’s equivalent ad-reach figure currently sits at 2.31 billion, and the difference between this figure and Facebook’s total MAU figure suggests that YouTube’s total active user base may already be well in excess of 3 billion too.
YouTube rarely updates its “official” user figures though, and – at the time of writing – YouTube’s resources continue to report that the platform “is used by over two billion people across the globe”, which is the same figure the platform has reported for the past four years.
But YouTube has revised its ad reach figures in recent weeks, and the latest reported total is actually slightly lower than the equivalent figure that the same tools reported back in July.
However, many of the other platforms in our top platforms ranking have reported significant growth over recent weeks, and we’ll explore those trends in more detail below.
Significant jump in reported TikTok ad reach
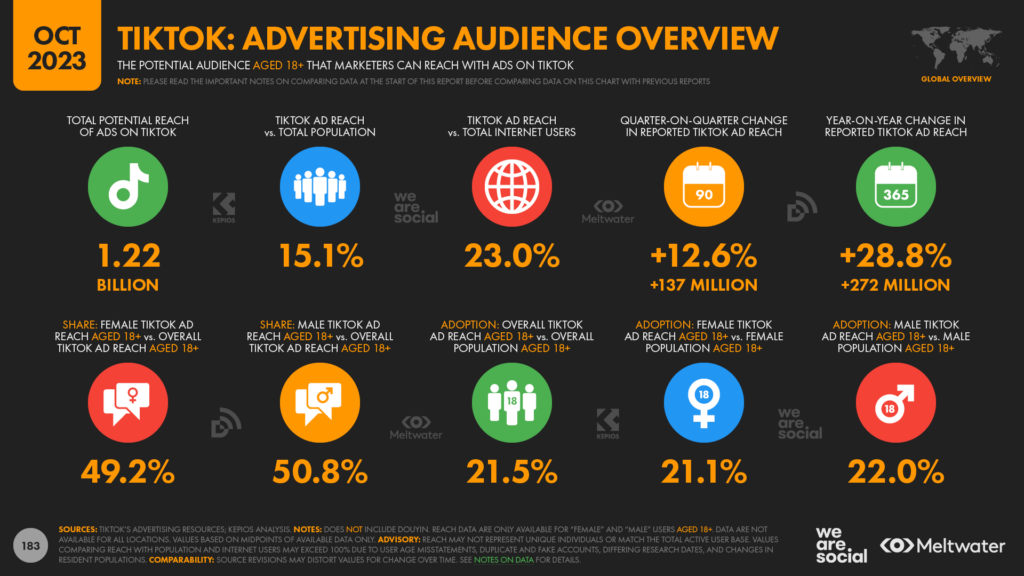
Figures reported in Bytedance’s own advertising tools suggest that the reach of ads on TikTok has jumped by a whopping 28.8 percent over the past year.
The company reports that ads on TikTok – not including Douyin – now reach more than 1.2 billion users each month, with that global reach figure increasing by more than 12½ percent in just the past three months.In absolute terms, TikTok’s ad reach has grown by 272 million accounts over the past 12 months, which equates to an average of more than 8½ additional accounts every second.
Vietnam delivered the largest relative growth over the past quarter, with Bytedance’s data alluding to a 40 percent jump in TikTok ad reach in the country between the start of July and the start of October.
During that same three-month period, reported reach figures have grown by close to 25 percent in Pakistan, while South Africa saw growth of close to 20 percent.
It’s not all good news for TikTok though, with reported ad reach actually declining across a number of markets over recent weeks.
Reported reach has fallen by roughly 6 percent in Switzerland during the past three months, while Austria and Germany also saw meaningful dips.
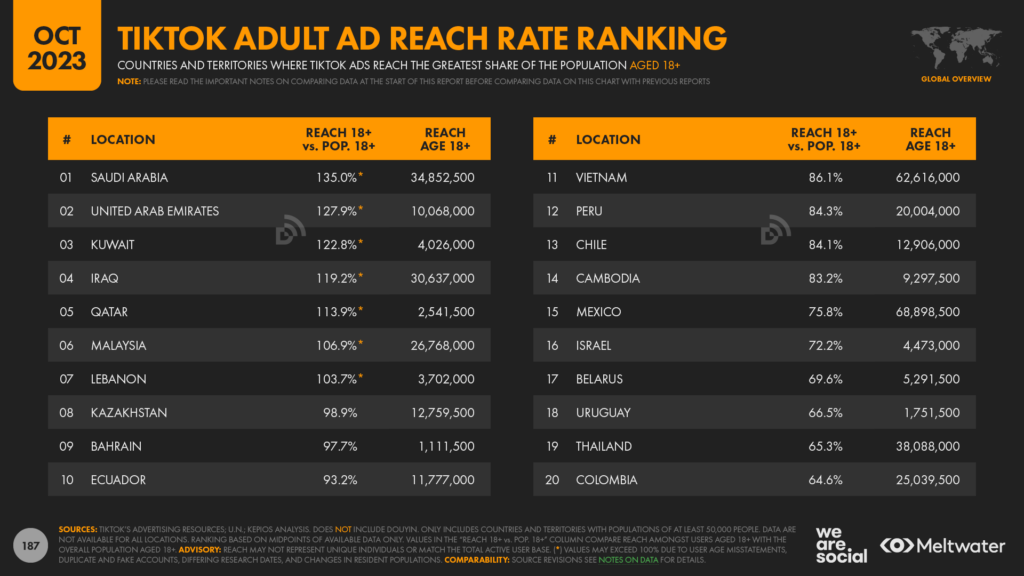
But TikTok’s overall figures paint a compelling story, with the latest data suggesting that more than 1 in 5 of the world’s adults saw an advert on TikTok during the past 30 days.
Meanwhile, in an even more eye-catching stat, the same dataset suggests that more than half (51.3 percent) of global adults between the ages of 18 and 24 saw an ad on TikTok in the past month.
And these figures are all the more startling when we consider that TikTok isn’t available in the world’s two largest countries [for reference, users in China can only access TikTok’s sister-app, Douyin, while TikTok remains blocked in India].
TikTok’s growth in perspective
However, it’s important to highlight that there are some important anomalies in TikTok’s reported data.
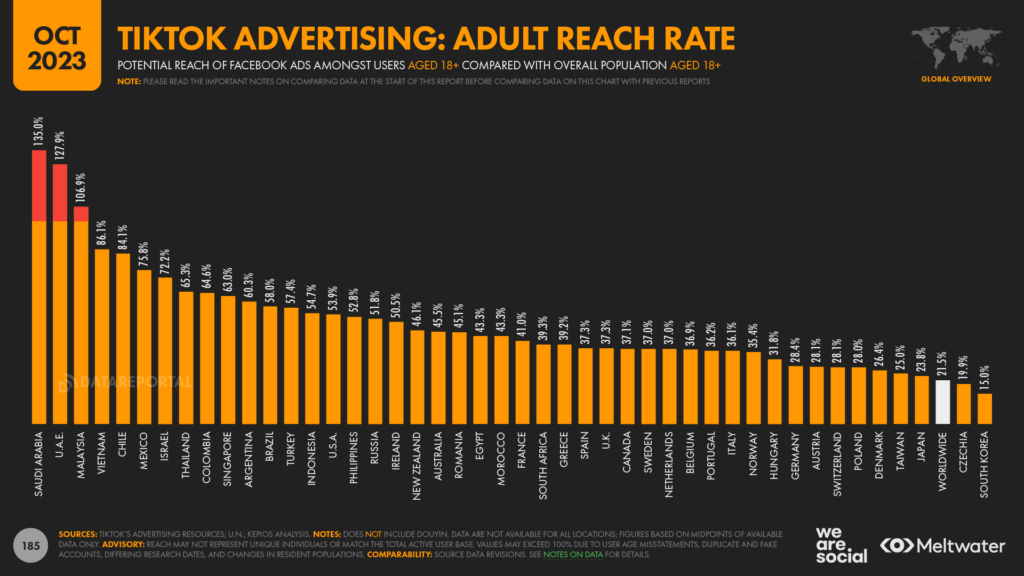
For example, the potential reach figure for audiences aged 18 and above reported in the company’s ad planning tools is now significantly higher than the total population in that age group in Saudi Arabia, the United Arab Emirates, and Malaysia.
There may be a variety of reasons for these improbable figures, including user age misstatements (e.g. younger users claiming to be older than they really are), as well as duplicate and “false” accounts.
Regardless of the reasons, however, it’s well worth comparing the platform’s own data against that of reputable third parties – a practice that we’d recommend when you’re exploring any aspect of digital behaviour.
For context, Bytedance’s tools report that advertisers can reach 34.85 million users aged 18 and above in Saudi Arabia in October 2023, which is equivalent to 135 percent of the country’s total population across this age group.
However, GWI’s latest data suggests that 70.1 percent of working-age internet users in Saudi Arabia use TikTok each month, which is roughly half the adoption figure indicated in Bytedance’s tools.
Meanwhile, figures from data.ai and Similarweb paint a similar picture to GWI, with active user figures and web traffic trends significantly below those that we see in TikTok’s own ad reach data.
These third-party figures are still impressive of course – reaching 70 percent of a country’s total adults is an exceptional achievement – but they also reinforce the need for marketers to consult multiple data sources when crafting their media plans.
But on that that note, third-party research tells another – and equally compelling – story about TikTok’s growing appeal.
Affinity for TikTok growing rapidly
Data from GWI shows that the number of people who state that TikTok is their “favourite” social media platform has grown meaningfully over recent months.
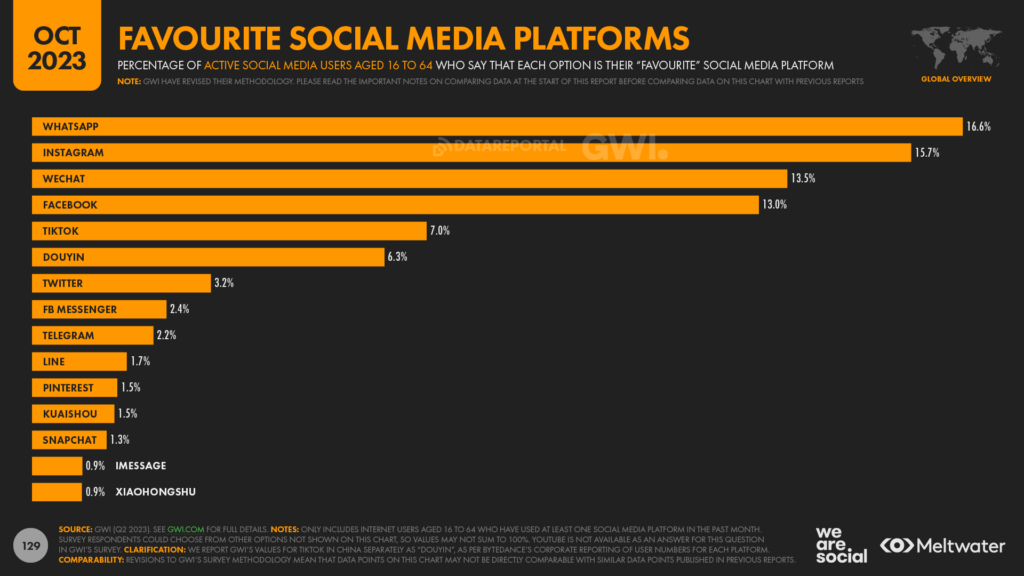
At a worldwide level, TikTok is now the preferred choice for 7 percent of working-age social media users, but it’s important to highlight that this figure doesn’t include Douyin in China [Bytedance reports data for these platforms separately, so we follow the same split reporting approach].
These latest figures place TikTok fifth in the global “favourites” ranking, although fourth-ranked Facebook still claims almost twice the number of votes as TikTok (13 percent vs. 7 percent, respectively).
WhatsApp is still the world’s favourite social media platform, with 1 in 6 working-age social media users identifying it as their preferred choice.
Second-placed Instagram has been closing the gap over recent months though, and WhatsApp’s stablemate is now less than one percentage point behind the global leader.
And for me, it’s these changes over time that tell the most interesting story in this dataset.
Affinity for Facebook falls
For perspective, the share of working-age internet users who say that Facebook is their “favourite” social media platform has declined steadily over the past couple of years.
Just two years ago, in GWI’s Q2 2021 wave of research, 16.5 percent of global social media users aged 16 to 64 identified Facebook as their favourite platform.
But in GWI’s latest wave of data (Q2 2023), that figure has fallen to 13 percent, representing a relative decline of more than 20 percent.
And interestingly, during that same period, affinity for TikTok has increased significantly.
Back in Q2 2021, just 2.6 percent of working-age social media users identified the Bytedance app as their favourite platform, but that share has increased by 2.7 times in just 2 years, reaching 7 percent in GWI’s Q2 2023 wave of data.
Meanwhile, TikTok’s sister-app, Douyin, appears to be stealing “share of love” from WeChat in China too, demonstrating the global appeal of Bytedance’s short-video formats.
It’s not all bad news for Zuck and team though; affinity for Instagram has also increased over the past two years, with the platform’s share of global votes up from 15.3 percent in Q2 2021, to 15.7 percent today.
However, there are trends within specific demographic groups that may point to trouble ahead for Meta.
Social media preferences by age
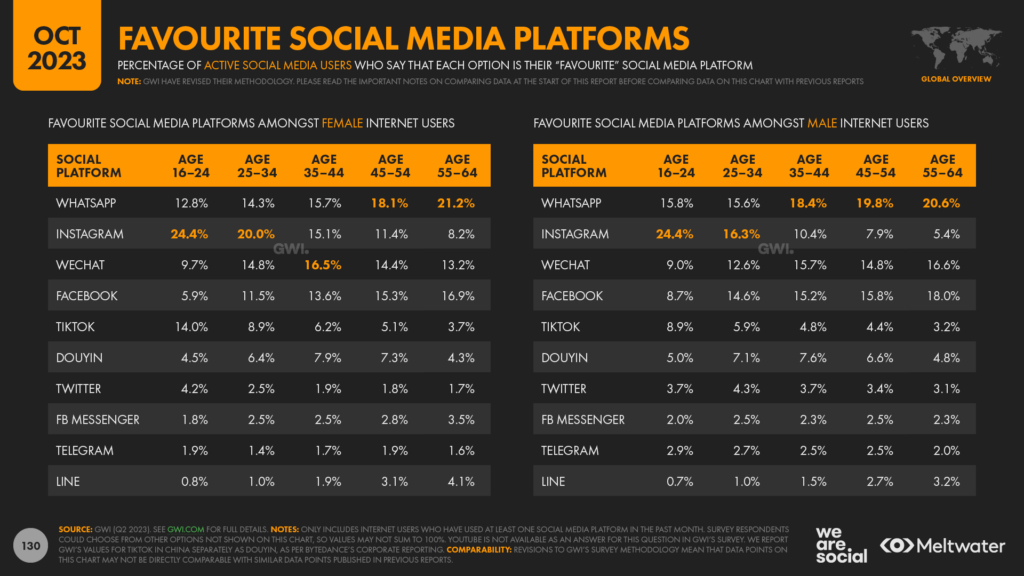
Instagram still sits pretty at the top of the “favourites ranking” for women aged 16 to 24, with close to a quarter of the worldwide vote.
Moreover, Instagram’s share of this cohort’s vote has actually increased over the past 12 months, from 23.2 percent in Q2 2022, to 24.4 percent in Q2 2023.
For perspective, that 1.2 percentage-point gain equates to a relative share increase of just over 5 percent during the past year.
However, TikTok’s popularity has grown significantly faster, with the short-video platform’s share of the vote increasing by a relative24 percent (+2.7 percentage points) over the past 12 months.
And we see a similar story for men in the same age group.
Instagram has increased its “share of love” amongst males aged 16 to 24 over the past year, but affinity for TikTok is growing significantly faster.
There has been less movement amongst the preferences of older age groups, and WhatsApp still dominates the rankings for people over the age of 45.
Facebook appears to be losing its appeal amongst this age group though, with both Instagram and TikTok gaining ground amongst older generations.
TikTok’s advertising audience now skews male
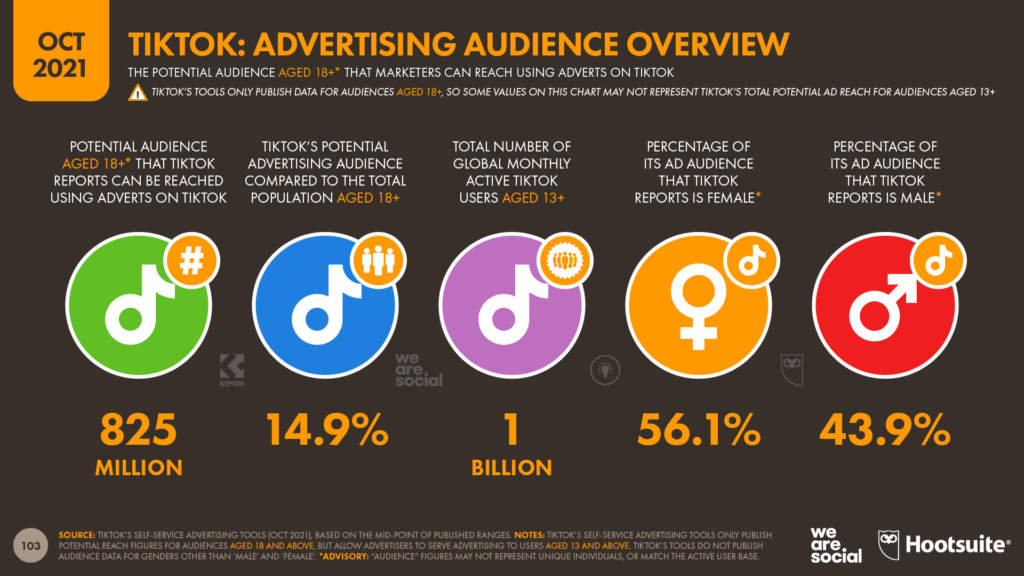
Returning to ad reach data, it’s interesting to note that – at a worldwide level – TikTok ads now reach more men than women [note that Bytedance’s ad tools only report audience reach data for binary genders].When we first started reporting TikTok ad reach in October 2021, we highlighted that women accounted for more than 56 percent of TikTok’s reported reach, compared with just under 44 percent for men.
But just two years later, male users appear to outnumber females, with men now accounting for 50.8 percent of TikTok’s adult ad audience.
Women still outnumber men on TikTok across the Americas and Europe, but a strong male skew across the Middle East and Africa tips the global balance in favour of men.
15.
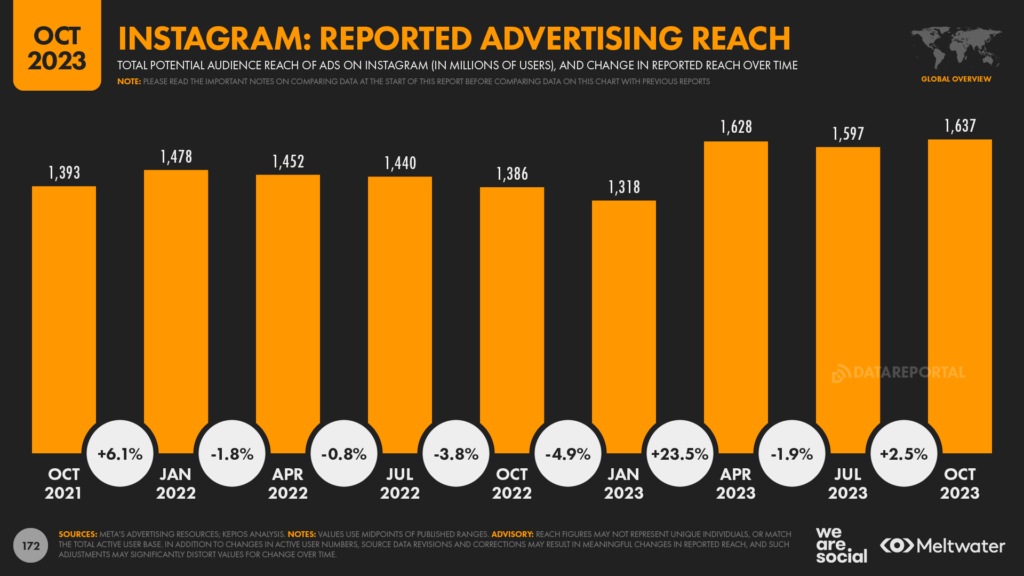
Instagram ad reach grows by quarter of a billion
But TikTok isn’t the only platform to have posted impressive gains over recent weeks.
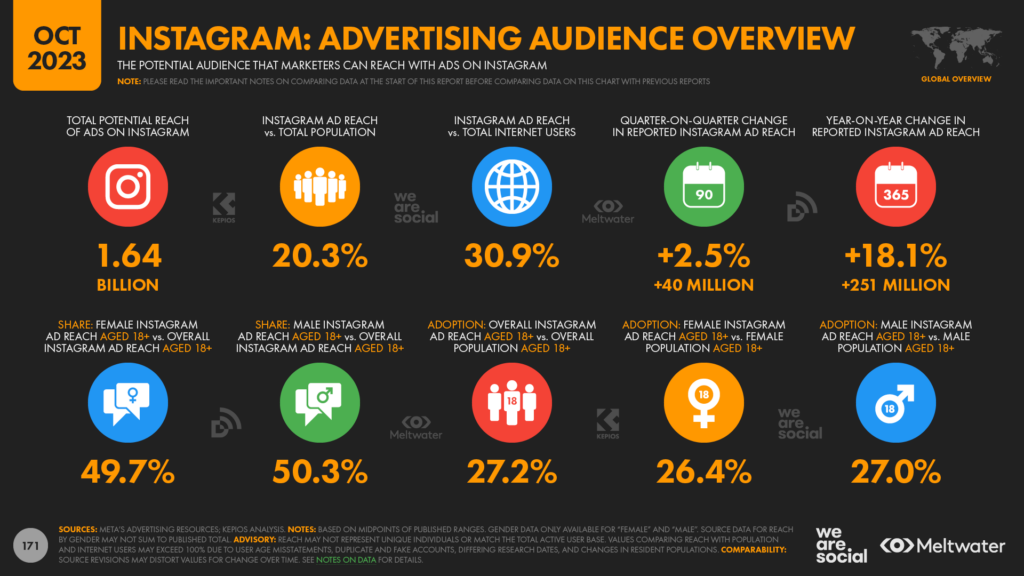
Figures published in Meta’s ad planning tools indicate that the number of users who see ads on Instagram each month has jumped by more than a quarter of a billion over the past 12 months.
Following sustained declines in reported reach during the course of 2022, Instagram now boasts its largest ever reach figure, with the current total up by 17½ percent compared with this time two years ago.
However, Instagram’s absolute growth in ad reach fell just short of the figures reported by TikTok.
Data published in Meta’s ad planning tools show that Instagram ad reach has grown by 251 million accounts over the past year, which is roughly 8 percent less than the 272 million additional accounts reported in Bytedance’s TikTok ad planning tools.
But we also identified some unusual trends in Meta’s latest audience figures.
Reported reach figures for Instagram audiences aged 13 to 17 have declined by a hefty 26.5 percent in just the past three months, despite that overall increase of 2.5 percent across all age groups over the same period.
Interestingly though, our analysis of third-party data doesn’t indicate any significant change in active use of the Instagram app by this cohort.
So, what’s going on?
Making sense of the metrics
Well, sadly, there’s nothing in Meta’s data itself to offer any conclusive insights.
However, as we reported in our April 2023 report, Meta recently stopped advertisers from being able to use detailed targeting for audiences aged 13 to 17.
And since that change, Instagram ad reach across this age group has tumbled, from 131 million in April 2023, to just 101 million today.
As always, it’s important to stress that changes in reported ad reach may not be in any way representative of changes in overall active use of a platform.
For context, Meta’s reported potential reach figures are largely influenced by the number of accounts that were shown ads on a platform in the recent past, as evidenced by this statement in the company’s own resources:
“Estimated audience size is… based on factors such as targeting selections, ad placements, and how many Accounts Centre accounts were shown ads on Meta apps and services in the past 30 days.”
So, while it may be tempting to interpret a rapid decline in teenage use of Instagram as a potential indicator of an “exodus”, in reality, this change is more likely the result of changes in advertisers’ targeting practices following those changes to Meta’s targeting rules.
And for added perspective, we’ve detected a similar – albeit less extreme – pattern in Facebook’s potential reach across this age group, which reinforces our belief that these declines are primarily the result of changes in advertiser activity, rather than changes in user activity.
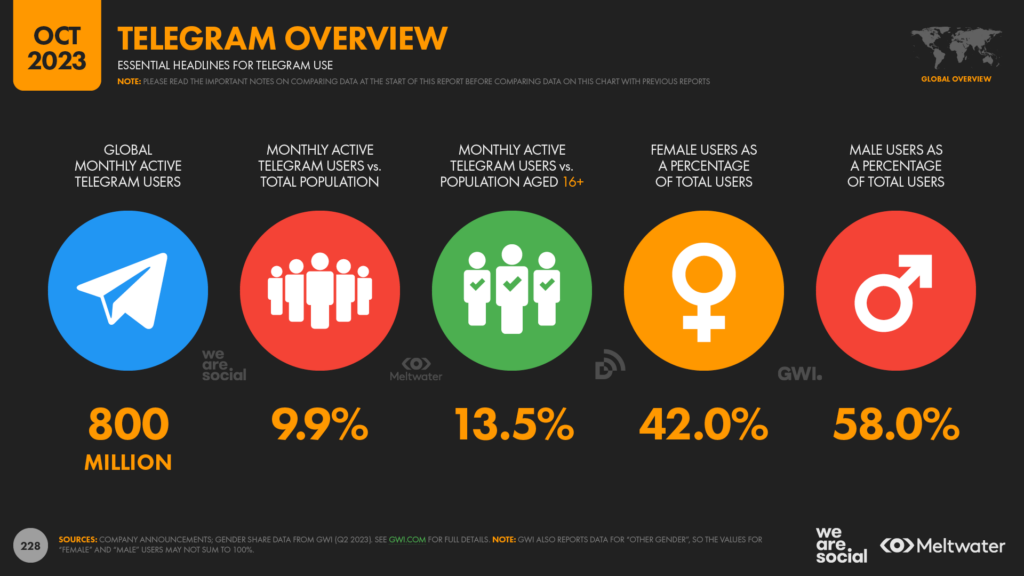
Telegram reaches 800 million
Telegram has also updated its monthly active user figure this quarter, with the latest “official” total published on the platform’s blog reaching 800 million.
For context, that means roughly 1 in 10 people on the planet now uses Telegram each month.
This latest update also shows that Telegram continues its impressive growth trajectory, with the new user milestone coming just over a year after the platform announced it had reached 700 million monthly active users.
That means Telegram has grown its active user base by roughly 14 percent over the past 14 months, at an average rate of 2.7 additional users per second.
Moreover, the latest figures available to data.ai subscribers suggest that actual Telegram use may be meaningfully higher than the company’s own statements suggest.
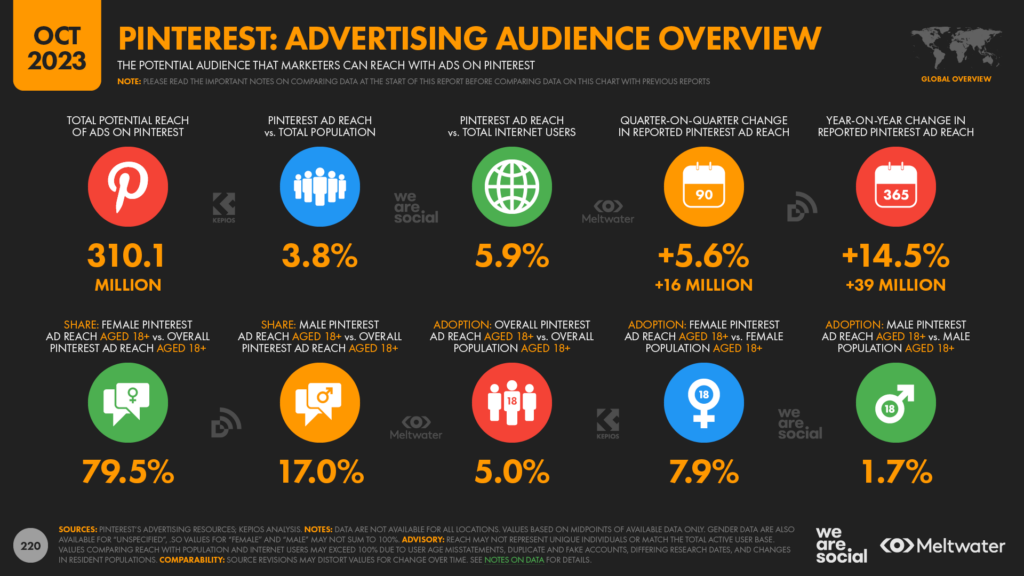
Pinterest ads reach more than 300 million
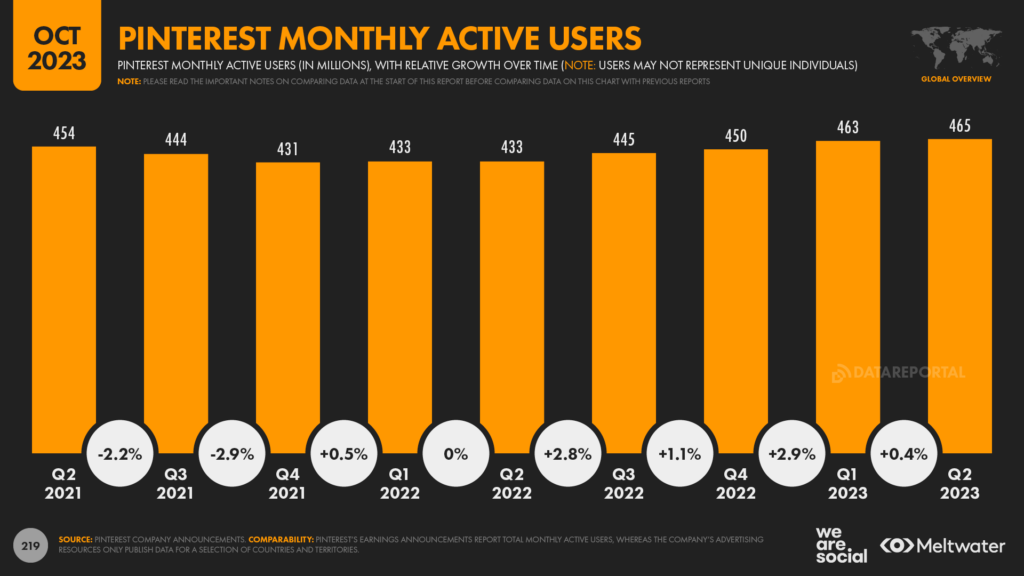
In its latest investor earnings announcement, Pinterest revealed that its platform now attracts 465 million active users each month.
That’s not quite as high as the largest MAU base that the platform has reported though, with that figure being set back in Q1 2021, when the platform saw 478 million monthly active users.
However, the platform does have a new record to celebrate this quarter: its ads now reach more than 300 million users each month.
That’s the highest reach figure we’ve seen reported in the platform’s own tools, and represents growth of 14.5 percent compared with the figures reported in the same tool this time last year.
It’s interesting to note that Pinterest’s ad audience remains overwhelmingly female too, with the company’s tools indicating that roughly 4 in 5 active Pinterest users are women.
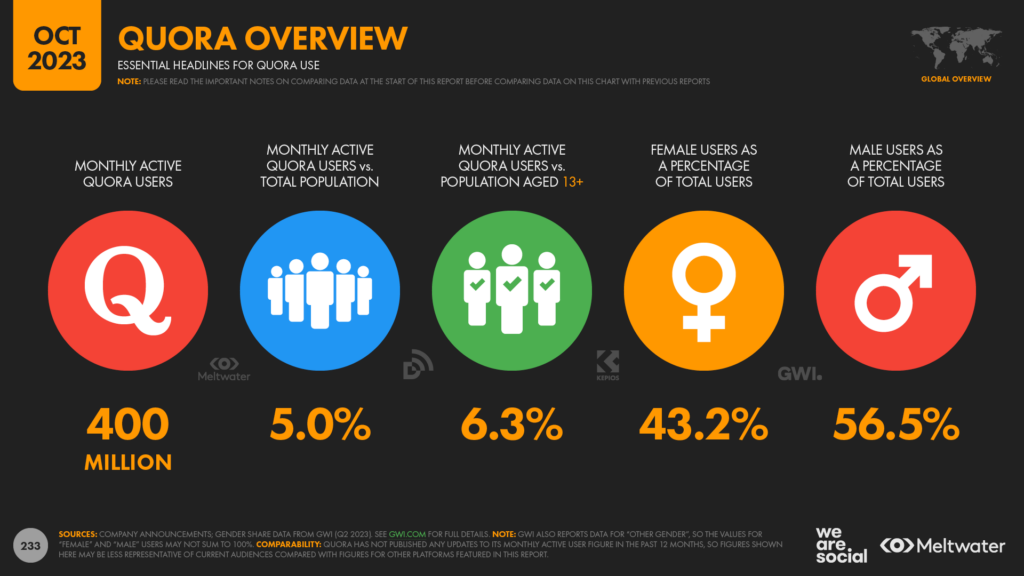
Quora reports 400 million active users
Quora recently updated the audience figures that it quotes to potential advertisers, with the question-and-answer platform’s Business page reporting a worldwide user base of more than 400 million monthly active users.
It’s unclear how quickly the platform’s audience has been growing, because the site hasn’t offered any new statistics over the past 4 years.
However, Quora’s Business Resources page does reveal that the platform has the following audience by location:
Quora users in the United States: 148 million
Quora users in India: 100 million
Quora users in Europe: 78 million
Quora users in South-East Asia: 24 million
Quora users in the United Kingdom: 22.5 million
Quora users in the Middle East and Africa: 20 million
Quora users in Australia and New Zealand: 11 million
Quora users in Canada: 15 million
Quora users in Japan: 6.8 million
Quora users in Mexico: 3.5 million
Quora users in Brazil: 2.6 million
Quora has also updated its pitch to marketers, making the following proposition:
“[Quora is] not a search engine and it’s not social media. It’s a high-intent destination somewhere in between – where people conduct research, evaluate products, ask for tips, and learn more about the world. People on Quora are actively seeking solutions, making it a premiere destination for thought leadership content about your company, products, competitors, and industry.”
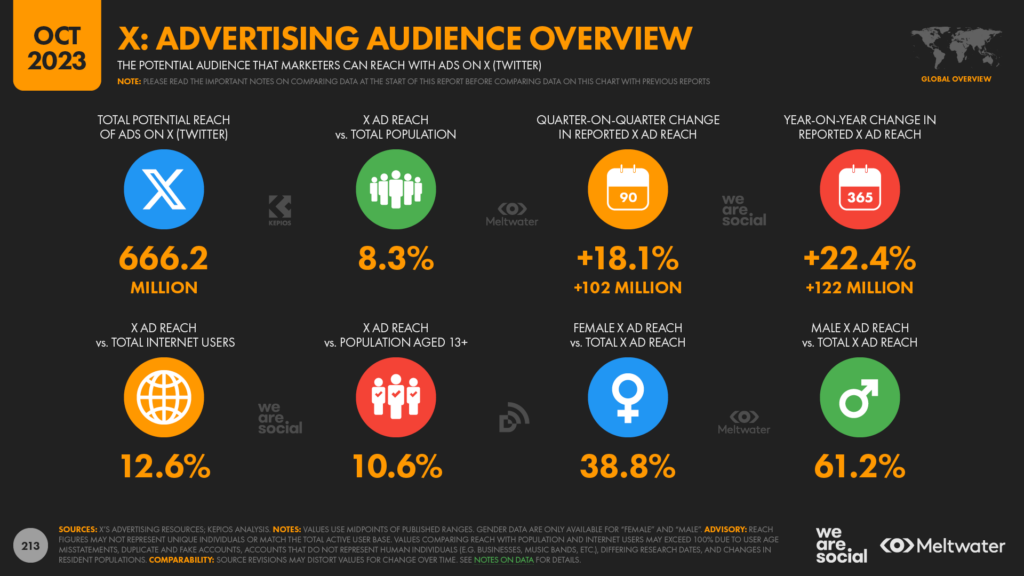
X continues to perplex
The latest figures published in X’s advertising tools show a significant jump in reach over recent months.
The platform formerly known as Twitter now reports that ads on its platform reach a total of more than 660 million users each month, with that figure up by a massive 18 percent over the past 90 days.
These figures suggest that X’s ad reach has grown by more than 1 million accounts per day over the past three months, at an average rate of 13 additional accounts per second.
However, these impressive trends seem to be largely at odds with data for actual use of the X platform.
Data published by companies including data.ai and Similarweb indicates that active use of the X mobile app has actually declined over the past three months, and traffic to the platform’s website has fallen too.
Similarly, worldwide downloads of the X app across the iOS and Google Play stores were lower in the July to September quarter than they were in the April to June quarter.
Meanwhile, Similarweb reports that traffic to ads.twitter.com has dropped by more than 10 percent over the past year, suggesting that fewer smaller advertisers may be looking to buy ads on the X platform [note: larger advertisers are more likely to book media through an agency, rather than visiting a platform’s self-service tools].
Recalibrating X-pectations
But despite these downward trends, the same data also demonstrates that X continues to attract a sizeable active user base.
Indeed, data.ai’s monthly active user figures for X’s mobile apps aren’t very different to the ad reach figures published in X’s own tools.
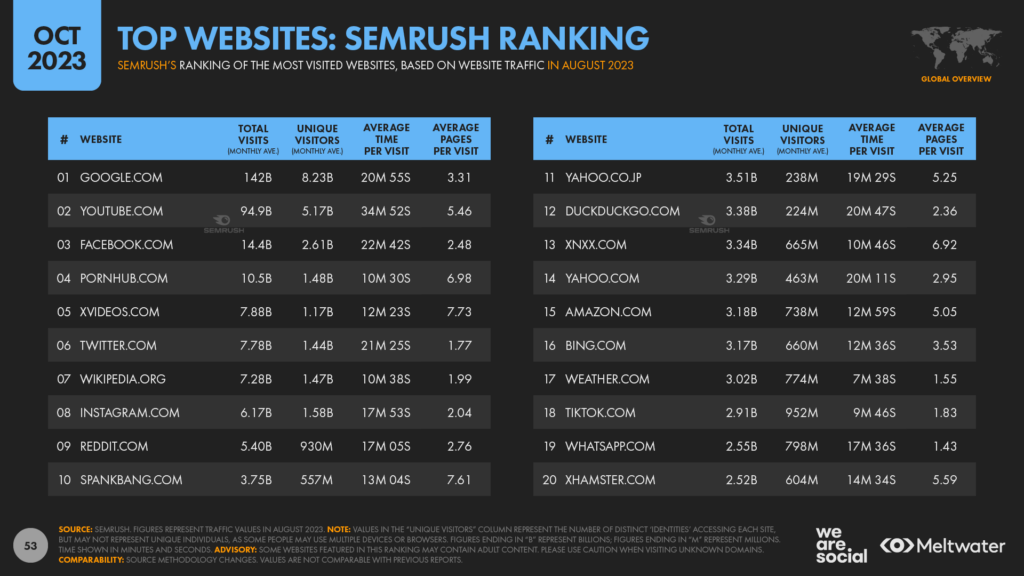
Meanwhile, traffic data shows that twitter.com is still one of the top destinations on the web, with Similarweb ranking the domain fifth at a worldwide level, and Semrush ranking it sixth.
Moreover, Semrush’s analysis suggests that twitter.com attracted more than 1.4 billion unique visitors in August 2023.
Despite the “unique” terminology, there’s inevitably some duplication in that figure, and it’s probably more helpful to think of this number as “unique devices” rather than unique individuals.
However, assuming that such duplication affects all sites to a similar degree, Semrush’s analysis puts X on a similar level to Wikipedia when it comes to global web traffic, which is testament to the enduring role that X plays in the world’s internet activities.
Has Threads unravelled?
And it doesn’t look as though Threads will steal X’s lunch any time soon, either.
The latest insights from data.ai suggest that – despite enjoying the fastest app launch in history – the newest addition to Meta’s stable hasn’t maintained its promising initial momentum.
Indeed, data from a variety of sources suggests that active use of Threads has actually declined steadily since the week of its launch.
Having said that, Threads still attracted more than 100 million users in September 2023, so the app is far from a “failure”.
However, the outlook for Threads doesn’t look quite as rosy as it did back in July, and the app registered fewer than 20 million combined worldwide downloads across the Google Play and iOS app stores in September.
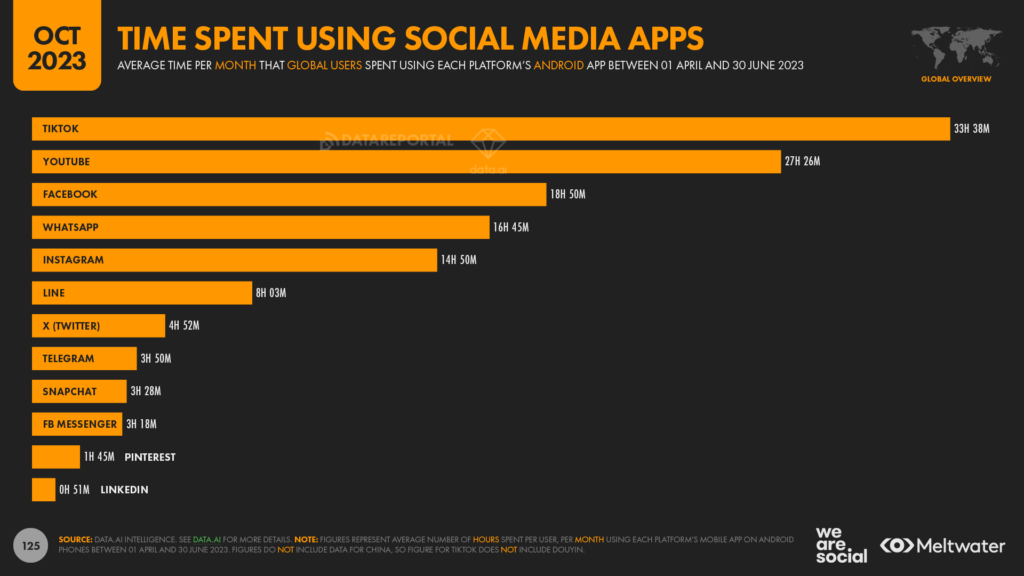
Time spent using social media apps
In addition to active user numbers, the amount of time that people spend interacting with social media platforms is another good indicator of where those services sit in our lives.
More great insights from data.ai reveal that TikTok is now the clear leader when it comes to average time per user, with the typical user now spending 33½ hours per month using the platform’s Android app.
For perspective, that means people now spend an average of more than an hour each day using TikTok, compared with the average of 54 minutes per day that users spend using YouTube’s Android app.
However, at a worldwide level, data suggests that YouTube reaches twice as many total users as TikTok, so YouTube is still the undisputed leader when it comes to overall time spent.
TikTok time is growing quickly though, with the monthly average increasing by more than 2 hours between December and June – an increase of 6.7 percent in just 6 months.
On average, the platform’s Android app users increased their daily TikTok time by more than 21 minutes each month across the first half of 2023, and trends suggest that these increases will continue in the months ahead too.
For comparison, YouTube grew average time per user by just over 1 minute per month during the same period, although the Google team will be encouraged to see that average use is at least still growing.
And in another finding to confound the clickbaiters, the average time spent using Facebook has also increased over the past 6 months, up from 18 hours and 17 minutes per month in the last quarter of 2022, to 18 hours and 50 minutes in the second quarter of 2023.
Meanwhile, Elon Musk will be encouraged to hear that the average time spent using X has also increased, with the typical user spending 4 minutes per month more on the platform today compared with this time six months ago.
Indeed, almost all of the top platforms saw average user time increase in the first six months of 2023, although the figures for WhatsApp and Facebook Messenger fell by 5 minutes per month and 1 minute per month, respectively.
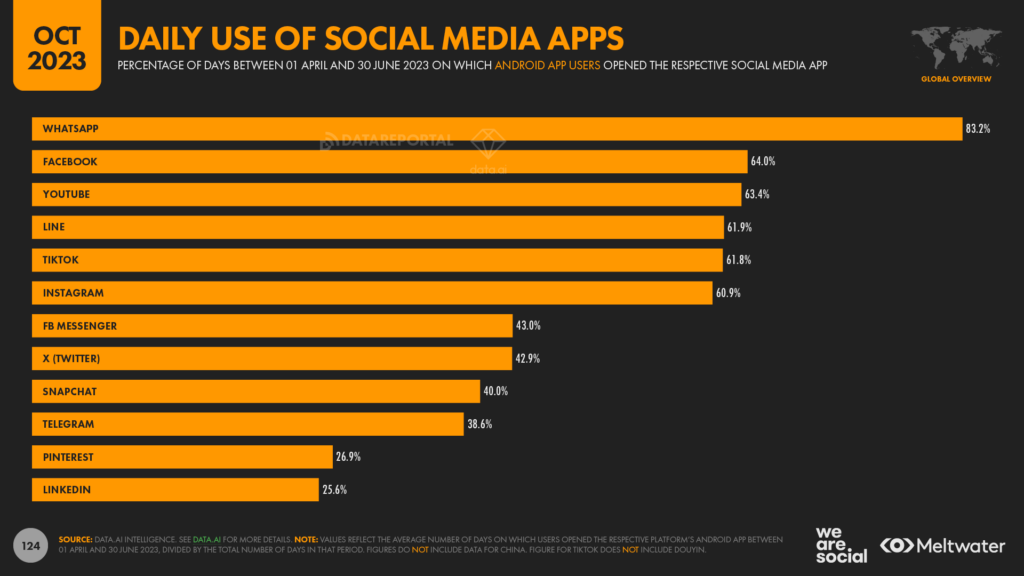
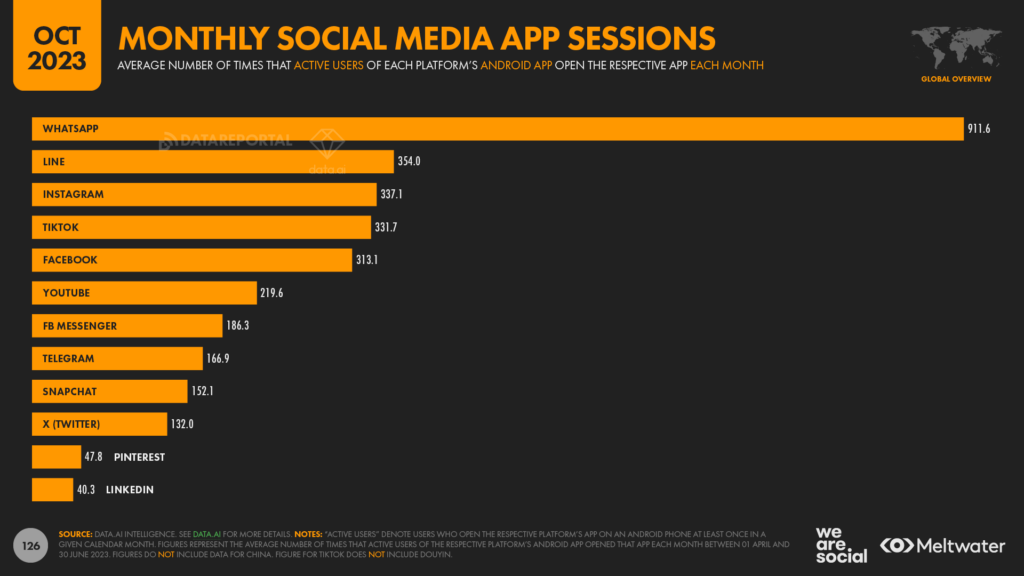
Frequency of social media app use
However, WhatsApp still enjoys by far the highest open rate of any of these apps, with the typical user opening the platform’s Android app more than 911 times each month.
That figure suggests that users open the app more than 30 times each day, but the data shows that – on average – WhatsApp users tend to go 1 day out of every 6 without opening the app.
Data.ai’s analysis indicates that 83 percent of active WhatsApp users open the app each day, which puts the app considerably ahead of its next nearest rival, Facebook.
Meanwhile, WhatsApp’s average of 911 sessions per user, per month is more than 2½ times greater than that of its nearest rival, LINE.
Japan’s most popular messenger delivers an average of 354 sessions per active user, per month, suggesting that the typical user opens the platform’s Android app more than 10 times each day.
However, data show that – in reality – roughly 62 percent of LINE’s Android users open the app each day.
Instagram tops the monthly session rankings for social networks, with the platform’s typical Android user opening the app 337 times per month.
And although LinkedIn’s figures are nowhere near as impressive as those of WhatsApp, it’s still interesting to note that the typical user still opens the platform’s Android app an average of 40 times per month.
Many of those sessions take place on the same day though, and data.ai’s analysis suggests that just over a quarter of LinkedIn’s Android users open the platform’s mobile app each day.
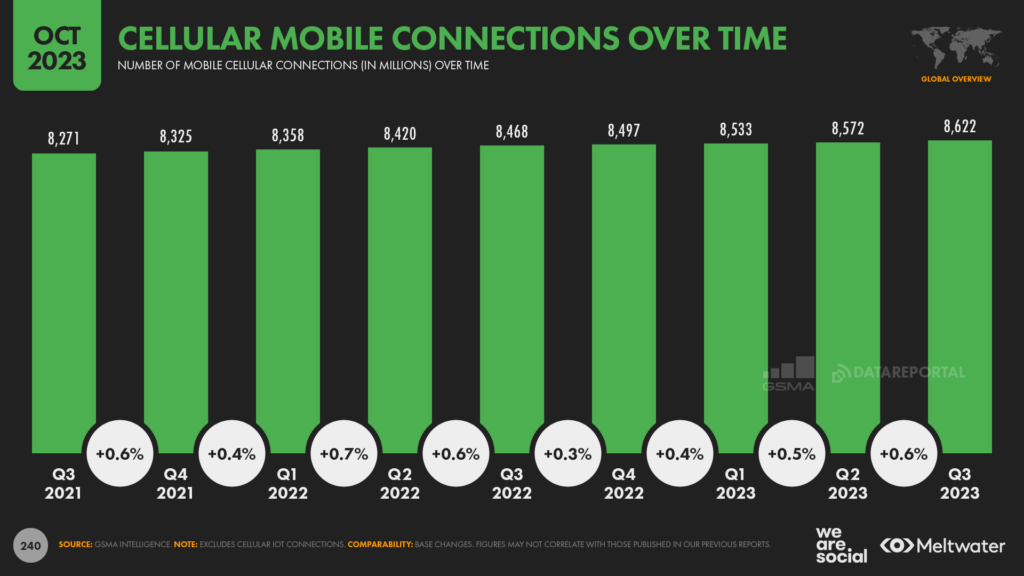
90 percent of mobile connections now broadband
The latest data from GSMA Intelligence indicates that more than 9 in 10 mobile data connections can now be considered “broadband”.
The organisation’s analysis of global mobile connectivity reveals that 7.84 billion of the 8.62 billion total phone connections in use today now make use of 3G, 4G, or 5G technologies.
Somewhat confusingly, there’s no standard definition for the transmission rates that a user might expect on a “broadband” mobile connection, but the Broadband Commission refers to a download speed of at least 10Mbps (see page 64 of this report).
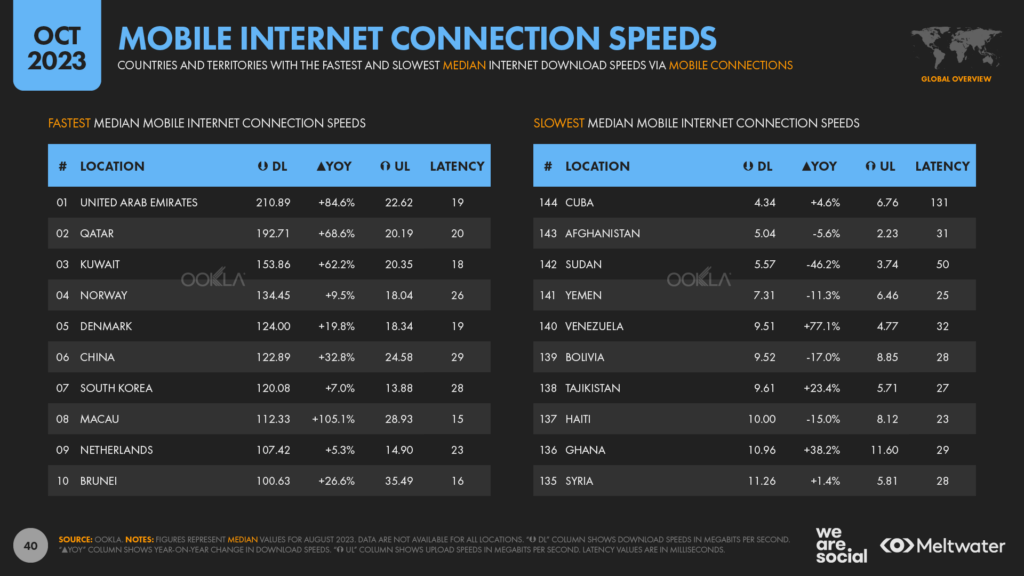
For context, the latest data from Ookla reveals that the median global mobile connection now delivers downloads in excess of 43Mbps – over 4 times faster than that broadband benchmark – but that median speeds still languish below 10Mbps in 7 countries around the world.
The picture looks quite different at the other end of the spectrum though, with mobile users in the United Arab Emirates enjoying a median mobile connection speed in excess of 210Mbps.
Based on Netflix’s stated requirements, that means the typical user in the UAE can now simultaneously stream a whopping fourteen 4K movies over their mobile data connection.
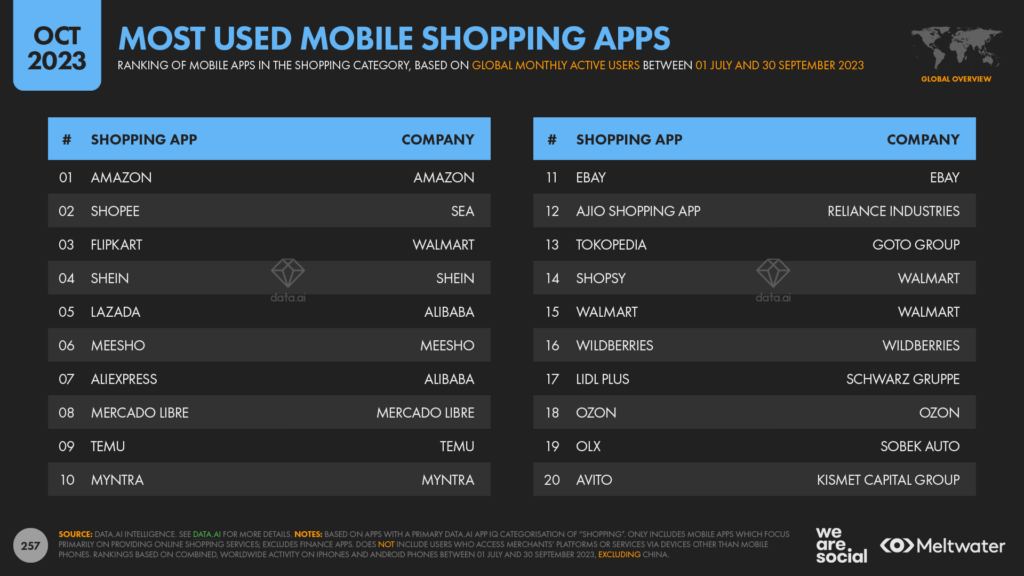
Temu enters the top 10
In something that may come as little surprise to some readers, Temu has now broken into the ten most used shopping apps at a worldwide level.
The latest ranking from data.ai shows that PDD’s marketplace app now attracts more monthly active users than Ebay and Walmart at a worldwide level, and the app sits just two places below Aliexpress.
And this achievement is all the more impressive when we consider that the app only launched in the United States in September 2022, meaning that it took Temu just under a year to achieve top ten status.
The app’s success hasn’t come without controversy though (see here and here), so it will be interesting to see whether its increasing popularity amplifies calls for greater regulation.
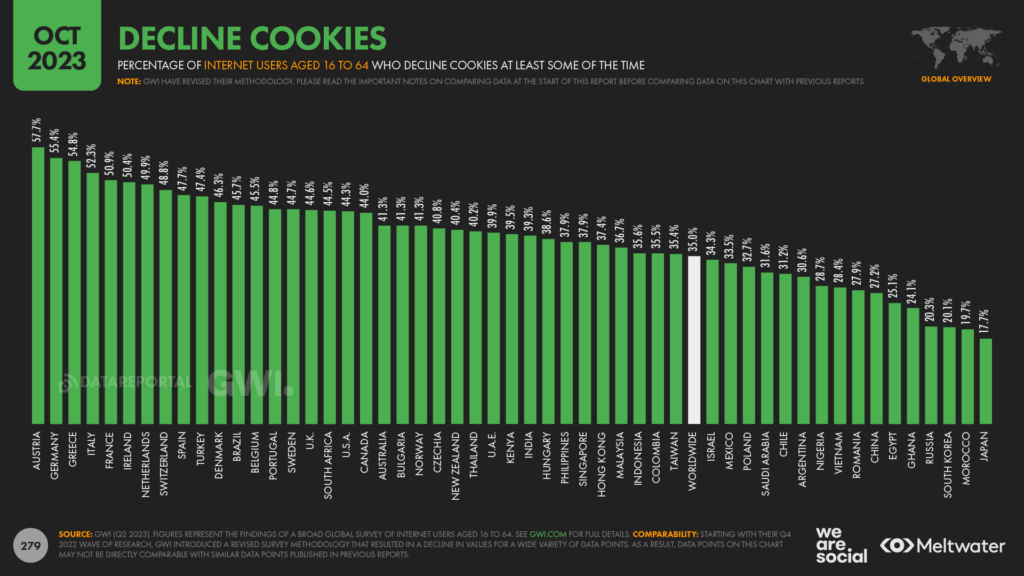
Europeans most likely to decline cookies
Given the European Union’s tough stance on online privacy, it’s perhaps not surprising to learn that internet users in Europe are the most likely to decline cookies.
At a worldwide level, just 1 in 3 working-age internet users says they decline cookies at least some of the time, which suggests that most people – 65 percent – always click those “accept all” buttons.
However, across EU countries, the share of internet users that declines cookies climbs to almost 48 percent – an increase of more than a third compared with that global average.
But even then, it’s worth highlighting that this figure represents the share of users who reject cookies at least some of the time.
In other words, despite the EU’s high-profile privacy crusade, most Europeans (52 percent) still don’t seem to care enough even to click on those ubiquitous “reject” buttons.
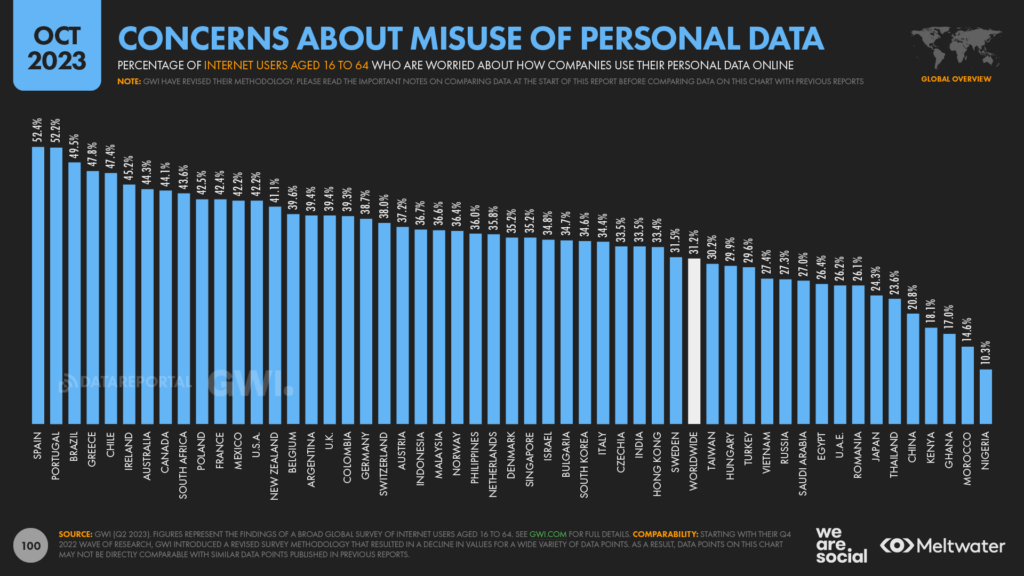
Moreover, less than 4 in 10 adult internet users (39.9 percent) across the EU say that they worry about how companies might use their data online, although that’s still considerably above the worldwide average of 31.2 percent.
But as an aside, it may also be worth noting that roughly a quarter (24.5 percent) of internet users across the EU also say that they worry about how their government tracks them online, which is also higher than the global average of 19.3 percent.
Are you talking to me?
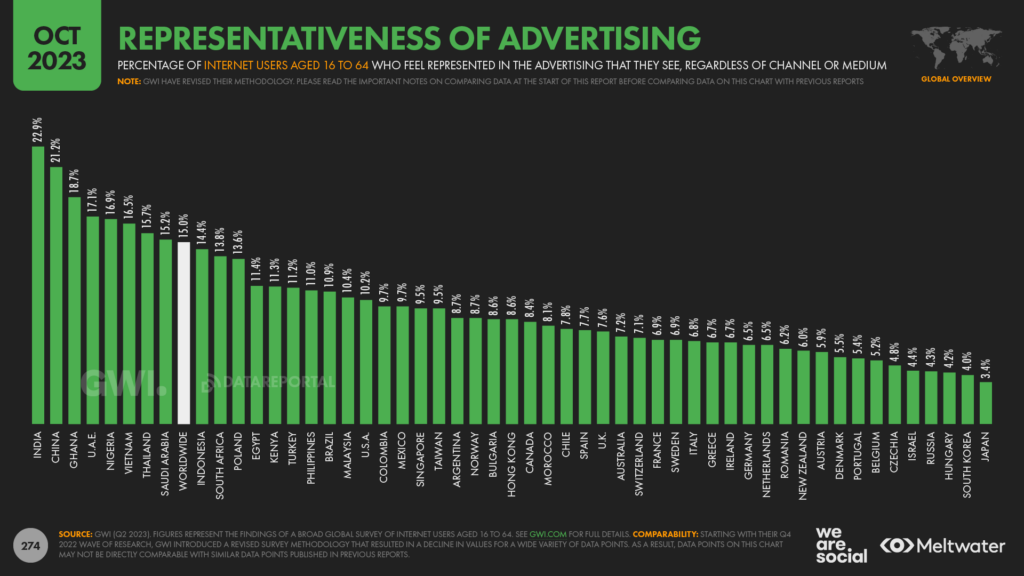
Research from GWI shows that – on average – just 1 in 7 people feel represented in the ads that they see.
People in India (22.9 percent) and China (21.2 percent) are most likely to see themselves in the ads they’re exposed to, compared with a global average of just 15 percent.
However, this figure falls to a paltry 3.4 percent in Japan, and remains below 5 percent across South Korea, Hungary, Russia, Israel, and Czechia.
Barely 7 percent of people across Europe – just 1 in 14 – say that they feel represented in the ads that they see.
And despite the hundreds of billions of dollars spent each year in the world’s largest ad market, that figure only just breaks 10 percent in the United States.
So, the essential takeaway here is that advertisers “must try harder”.
With all the data that’s available to us, there’s really no excuse for not understanding who our audiences are, what interests them, and where we should engage them.
My tip: in 2024, move some of your creative and media budget into research that helps you understand what “representative” looks like for your audiences, and let’s see if we can move that dismal average of 15 percent up to at least 20 percent by this time next year.
Outlook for the year ahead
Hopefully that comprehensive analysis has given you a firm grasp on the state of digital at the end of 2023… but what might the future hold?
As has become customary in our October Statshot analysis, let’s conclude our Digital 2023 coverage with a look ahead.
But this year’s outlook is a bit different…
Just imagine
As the incredible power and potential of AI becomes increasingly accessible to everyday users, I believe we’re on the cusp of major changes in the roles that connected devices and technologies play in our lives.
However, AI isn’t without its challenges, as I experienced first-hand while preparing this year’s outlook.
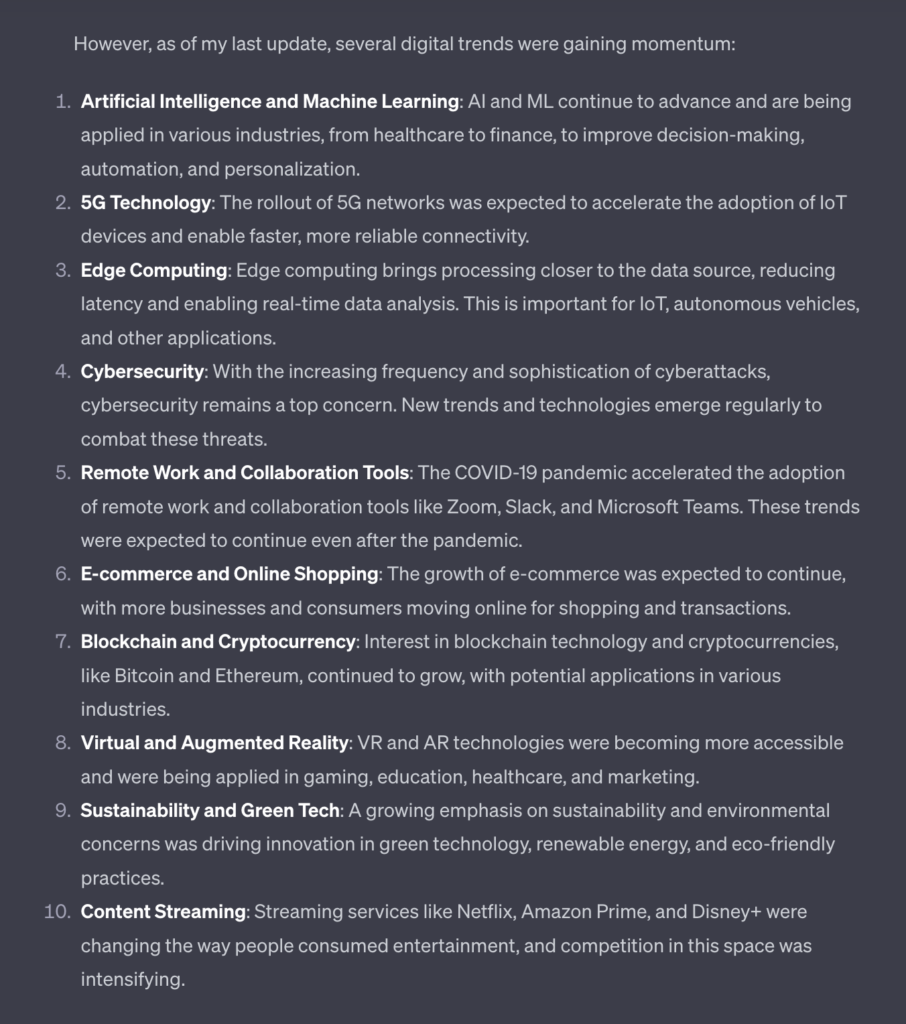
As part of my research, it seemed only appropriate that I ask various AI tools – ChatGPT, Bard, Claude, etc. – to identify the key themes shaping the future of technology in marketing.
Some tools gave more interesting answers than others, but almost all of their prognoses seemed to involve a “recycling” of familiar themes.
That’s absolutely what I expected, though; generative AI tools still depend entirely on the inputs and historical content on which they have been trained.
As a result, they excel at synthesising and repackaging ideas that already exist, but – in late 2023 – they’ve not yet reached a stage where they can “imagine” the future.
And that’s fine; we simply need to acknowledge these limitations, and understand how best to use these AI tools.
But therein lies a problem.
History repeating itself
Many humans still seem to struggle with how to use AI tools to add new value – especially when it comes to writing content for the internet.
For example, in addition to asking AI tools for their “thoughts”, my research also involved analysing close to 100 different “trends forecasts” published across the internet [yes, I’m a nerd].
But by the time I reached the fourth or fifth “forecast”, I started to notice a distinct pattern: the same handful of topics came up again and again… and again.
Here’s why:
This is nothing new of course; recycling seems to be an inescapable theme in trends predictions, and this time two years ago – well before the release of ChatGPT – pretty much everytrendsforecastextolled the potential of the metaverse and NFTs (ahem).
However, the repetition I’ve seen this year feels different to previous years, largely because many of those 2024 “predictions” seem to be stuck somewhere in late 2021.
And that’s not a coincidence.
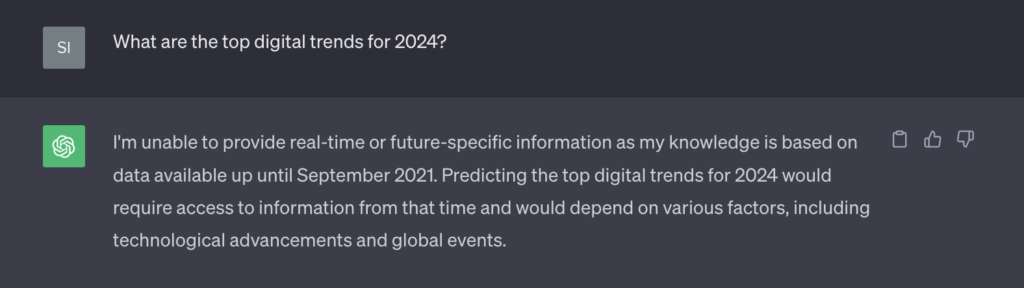
It’s only been a couple of weeks since ChatGPT issued an update that enables users to search the internet as part of their queries.
Before that, users could only access results based on training data that ended in September 2021.
ChatGPT even alerts users to this limitation, but many “writers” – recyclers – seem to have ignored OpenAI’s warnings.
The future ain’t what it used to be
To be clear, none of these themes were out of place in trends forecasts in 2021, and many are still absolutely relevant.
However, because we’ve seen them before, these “recycled forecasts” have less value than they did three years ago.
Yesterday’s weather forecast isn’t as valuable as tomorrow’s, because it doesn’t help us make the best informed decisions for the future.
So, before you dive into any of the other 2024 forecasts you’ll find out there across the web, here’s what you should watch out for.
Existing truths
TikTok is not “the next big thing”, because it’s alreadyhuge.
Similarly, 5G networks are already widespread, and they have already delivered a “profound impact” on mobile connectivity.
These technologies will still be perfectly relevant in 2024 of course, but in the same way that Facebook, SEO, and TV ads will be.
Changes in direction
The rise of voice search was a top trend in late 2021, but adoption rates slowed abruptly in early 2022, and I’m not convinced it should be a top priority for marketers in 2024.
For clarity, voice interfaces still have a promising future, but that future will probably look quite different to the one I outlined three years ago.
Moreover, voice’s full potential will likely only be realised when other devices (e.g. smart glasses) gain more widespread adoption.
Back to the future
Perhaps my biggest realisation as I read this latest crop of digital trends forecasts is that we all seem to be chasing “speculative distraction”.
For example, I don’t doubt that quantum computing will fundamentally change our lives, but I do doubt that you need an innate understanding of qubits in order to sell breakfast cereal or running shoes.
Much as they’re fascinating, most of these topics are tantamount to trivia for the average marketer.
So, rather than worrying about whether your brand has a strategy for entangled connectivity, here’s where I would recommend you focus your planning efforts for 2024.
Stop expecting alchemy
Most of the marketers I speak with seem to be on a never-ending quest for a mystical “holy grail”.
No sooner have they added the latest shiny toy to their toolbox, they’re already asking, “what’s the next big thing?”
But new platforms and tools alone won’t make you a better marketer, just as collecting guitars won’t make you a better musician.
Rather than chasing shiny new toys, focus on how you can use what you’ve already got to create more value for your audiences, and deliver better outcomes for your brand.
Measure what matters
Goodhart’s law states that “when a measure becomes a target, it ceases to be a good measure”, and our industry provides ample evidence of this.
Marketers have become so obsessed with metrics like engagement, they’re even willing to spend money buying fake “engagement”.
This is the equivalent of offering a stranger $20 to tell you that you’re cool.
What’s the point? Ultimately, you’re only cheating yourself.
Yes, measuring tangible value contribution is difficult, and there’s no one-size-fits-all approach.
You need to put in hard work to get meaningful results.
But this is like getting fit: it’s really hard to get up off the couch, but the sooner you start, the sooner you’ll see results.
My advice is to start by asking yourself some simple questions:
Which overall outcomes does my brand or organisation hope to achieve?
How do my team and I contribute to achieving those outcomes?
How can we identify whether we’re actually delivering a meaningful contribution?
What do we need to know to improve?
Focus on the answers to those questions, and you’re less likely to get distracted by meaningless tools and metrics.
Be remarkable
Differentiation is a core tenet of marketing: we need to give people clear and compelling reasons to choose our brand and its offerings over alternatives.
But most marketers seem to be preoccupied with copying other brands’ products and campaigns.
And the problem with this “me too” approach is that it’s unremarkable.
As one of my favourite adages states, “once you’ve seen the bandwagon, it’s already too late.”
Fundamentally, there are only two ways to differentiate: be better, or be different.
If you’re neither, your audience has no reason to notice you, which significantly reduces the chance of them choosing you.
Yes, being meaningfully better can be exceptionally difficult, especially in crowded markets.
And yes, being genuinely different requires great bravery, which is also exceptionally difficult when you must gain the approval of multiple stakeholders.
But therein lies a choice: you can either reconcile yourself to comfortable mediocrity – which is absolutely fine if that’s what you want – or you can commit wholeheartedly to the hard work required to achieve greatness.
The world of tech in 2024
But but but… what about the trends?
OK, if you absolutely insist on knowing which tech-related trends I’m watching most closely, here are my current top three:
Humanless transactions: I started exploring “marketing to the machines” back in 2016, but the concept has gained momentum with the rise of AI-powered assistants. This development poses existential challenges for marketing, not least because there’s a very real chance that people will “delegate” their decision making to algorithms – especially when it comes to low-involvement categories and repeat purchases. That future is likely still some way off, but in the short term, I expect to see a proliferation of content that has been produced almost entirely by algorithms, with the express purpose of influencing other algorithms.
Digital “geopardy”: as politicians the world over continue along a path of anti-diplomacy, I expect to see protectionism, antagonism, and conflict result in deteriorating digital experiences. Specifically, I think we’ll see more platforms being blocked, more feeds being co-opted for misinformation, and a further tendency towards content partisanship and extremism. Yes, that’s a pessimistic outlook, but you and I can still influence how this unfolds. Vote carefully. Stop using platforms that negatively affect your mental health and emotional wellbeing. Unfollow antagonists, and diminish their reach and influence by refusing to engage, no matter how “wrong” you think they might be. Above all, be intentional; the internet was never intended to be a “passive” medium, so don’t sit back and let the bots determine your destiny.
Intrinsic interfaces: innovations in areas such as gesture control will continue to change the way we interact with our devices. We’re still some way off from escaping screens completely, but motor movement sensors and ambientinterfaces are increasingly finding their way into our everyday lives. Amongst other things, this shift away from screens will fundamentally change the dynamics of “content”, and require marketers to think beyond interruption as their primary means of introduction. As seems to be the case each year though, my advice here is simple: focus on how you’ll add value to your audience – not just on what the tech can do – and you’ll always be best placed for success.
That’s all for this year… I’ll be back with you in January to introduce our flagship Digital 2024 Global Overview Report, but until then, I hope you have a successful Q4, a relaxing break at the end of the year, and a great start to the year ahead.
 Report