comScore: 2013 US digital future in focus

comScore recently released their ‘2013 U.S. Digital Future in Focus’ report, an analysis of the last year’s digital trends in the US and how they’re likely to affect the coming 12 months. Here’s our lowdown on everything you need to know.
Social networks
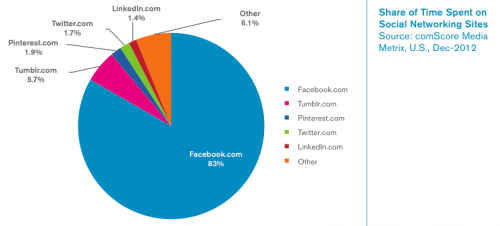
The major trend this year has seen social media platforms attempting to monetise and focus on building reliable long-term business models, as the location of new revenue streams has led to growth in social networks large and small. Unsurprisingly, Facebook still holds a huge share of social networking market, with 83% of total time spent on such sites accounted for by the platform. Perhaps slightly less expected is second place; Tumblr takes the spot with a 5.7% share, followed by Pinterest (1.9%), Twitter (1.7%) and LinkedIn (1.4%).
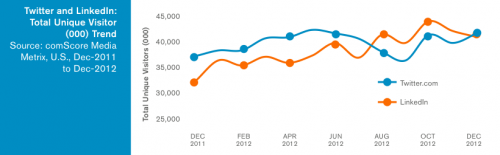
Other networks are increasing their unique visitor numbers, as shown below by Twitter and LinkedIn. One point worth noting from the below graph is the mixed end to the year for both the networks and it will be interesting to see if they can continue their rate of growth, or begin to reach saturation point.
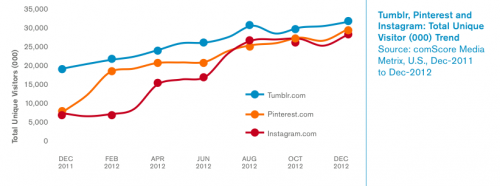
The most exciting growth is being shown by relatively young, very visual networks, namely Tumblr, Instagram and Pinterest. These have continued strong growth throughout the year.
Digital advertising
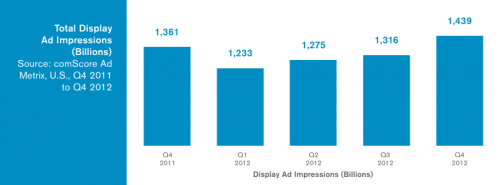
This year showed a huge amount of digital advertising, with 5.3 trillion display ad impressions, peaking with 1.4 trillion in Q4, a 6% increase from 2011.
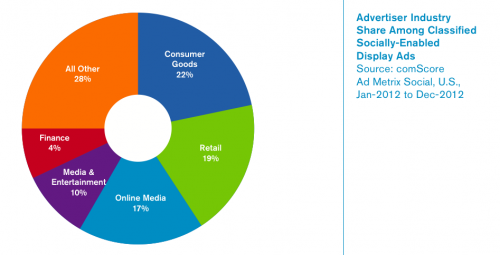
The link between digital advertising and social media is becoming all the stronger, too. 1 in 8 web ads are now socially-enabled, meaning they direct consumers to social media destinations, e.g. by asking for a Facebook ‘like’ or Twitter ‘follow’. The most socially-enabled advertising area lies in consumer goods, with almost 1 in 5 of all adverts displaying such characteristics. Indeed, consumer goods take a 22% share of the socially-enabled advertising share.
Online video
The figures don’t lie. Video as a medium is going from strength to strength online.
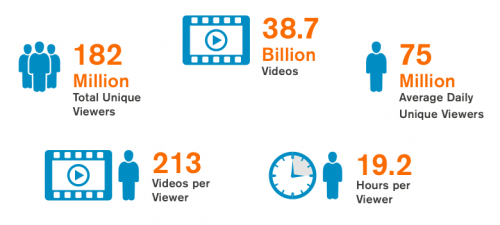
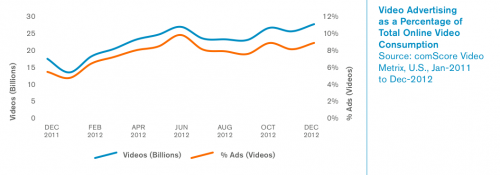
Like many other social platforms, video-sharing networks like YouTube have shown an increasing interest in monetising content. As the number of videos watched online rises, so does the percentage of these that include advertising, up to 23% in 2012 from 14% in 2011. Even more positive for advertisers is that people are happy to watch these videos, with the graph below displaying how ad-related video consumption is also on the up.
This growth has seen YouTube maintain a huge share of the video audience, with 188 billion uploaded to Google sites, 42% of all video content posted online in the US. Hulu was second with 8.9 billion, VEVO third with 7.6 billion, then Yahoo with 7.3 billion and AOL with 7.2 billion.
E-commerce and the growth of m-commerce
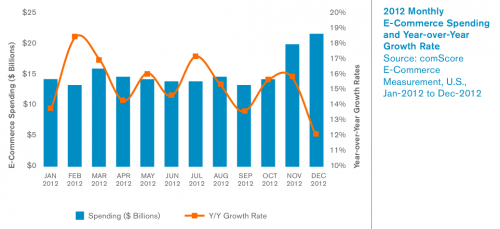
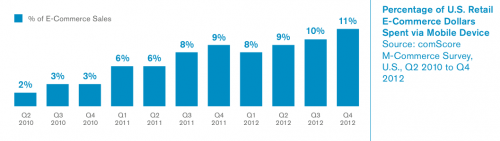
E-commerce is becoming more popular amongst American audiences. Over the year, $289.1 billion was spent online, a 13% increase from 2011. The amoung of money varied, as you would expect, throughout the year and was highest in the lead-up to Christmas; nevertheless, every month saw an improvement on the year before.
A larger and larger chunk of online shopping is now coming from mobile devices. By Q4 2012, 11% of all US-commerce dollars were spent via a mobile device, compared to 9% in 2011 and just 3% in 2010.
Mobile and tablets
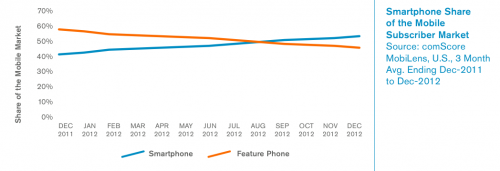
The mobile revolution was not limited to shopping, either. 2012 has seen smartphone ownership on the up, overtaking feature phones for the first time ever. Of these, Androids account for 53.4% and iOS 36.3%. Tablets, too, are on the rise; 28% of all smartphone owners also possess one of these devices.
People are using their mobiles to go online, too, particularly to get social. 37% of all time spent online comes from mobile and Facebook and YouTube both rank in the top 10 mobile apps by reach. In fact, the former comes in at number 1.
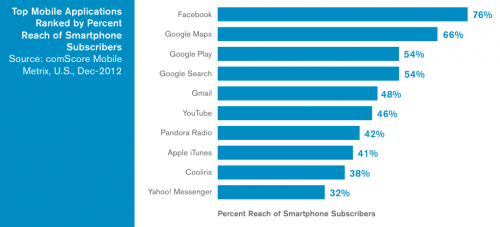
The potential benefits for digital marketers in mobile are huge, as shown by the reach of the apps listed above. This really does translate into additional overall reach, too; on average, the top 25 digital properties extended their reach via mobile by 29%.
So what does the future hold?
In short, it’s set to be an interesting time for the digital world. 2012 has seen a great deal of growth across social and mobile, as well as digital advertising; all this is set to continue. Monetisation and ROI will be expected more and more, social strategies that reflect the desire for simplicity, scale and success metrics will be well-placed to succeed in this environment. Finally, we’ll see a few online battles hot up even further: especially in the realm of search, as social search engines like Facebook’s Graph Search come into play.