Video Consumption Is Soaring, But Do We Know Who Our Viewers Are?
In the past year, marketers have placed increasing emphasis on video consumption and best video formats. Facebook has an average of 8 billion daily video views, we post 75% more videos than a year ago, and many argue that the ideal video length is 30 seconds.
The chorus is increasingly tiresome and predictable – Let’s choose this format and that length to gain highest views possible. However, we often neglect the very people behind these views. To understand our audiences, this article examines video consumption behavior in Asia.
When streaming videos, WiFi is the most common connection used. Exceptions are India and Indonesia, where there is high dependence on mobile networks. [i]
This then raises questions of where and when people are watching videos. In Asia, the majority of video watching still occur indoors (93% – home, 24% – work, 17% – in a public building). [ii]
However, we anticipate a shift in behavior as initiatives like YouTube accelerator are introduced in emerging markets. YouTube accelerator is piloting in the Philippines and the idea is to cache YouTube videos over hotspot networks. When people are connected, these videos stream efficiently.

For its generous public WiFi programme, Google India also deserves a pat on its back. This year, up to 90 railway stations will offer free WiFi to 1.5 million people. With such initiatives, we expect more people to watch videos while out and about.
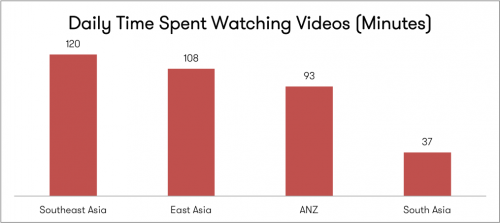
On a daily basis, Southeast Asia spends the most time watching videos.

Source: Millward Brown (2016) http://bit.ly/1KbmpxD
One of the biggest reasons for this is long commuting times. For example, residents in Indonesia spend an average of 400 hours a year travelling to and from work. That is equivalent to watching 7 Harry Potter films back to back, 20 times over.
WARC also reported that 69% of Indonesians delay bedtimes because they are hooked to their mobiles at night. Skincare brand Citra maximised this insight, and encouraged consumers to send mobile cards wishing others goodnight. Similarly, brands should explore when their consumers are watching videos and deliver content that is timely and relevant.
In Vietnam and Thailand, practices of Buddhism inspire people to be humble and compassionate. There is a preference for long-form, emotionally-charged narratives that are also known as “sadvertising” or “pathos”. With a clearer picture on cultural dispositions, brands can create videos that resonate with audiences.
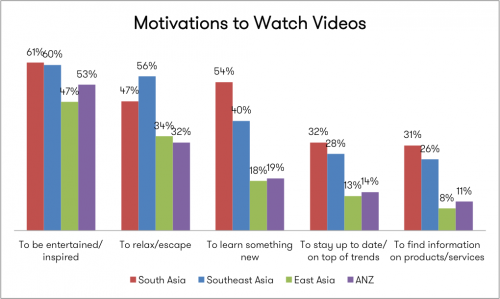
While videos provide entertainment and escape, Asians increasingly depend on them to learn something new.
Learning how and when people watch videos is great – but let’s go one step further. What are the main motivations behind video viewing, and how does this differ across Asia?

Source: Google Consumer Barometer (2014-2015) http://bit.ly/1SrFAOp
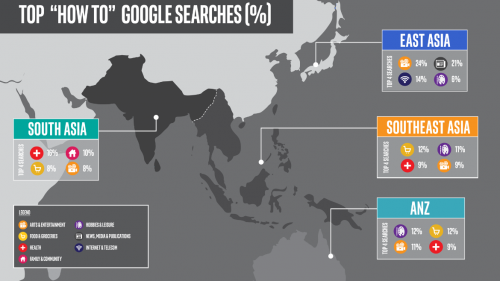
The good folks at Google examined “I-want-to-do” moments, where consumers regularly conduct “how to” searches and turn to online videos. In fact, 67% of millennials agree that they can find a YouTube video on anything they want to learn. Call us nosy – We personally prefer “curious with a purpose” – but we wanted to identify top “how to” searches across Asia.

Source: Infographic by We Are Social (2015-2016) [iii]
In South Asia, searches were mostly on health, as well as family and community. Findings on family and community were incredibly eye-opening. Many people want to impress their partners sexually, prompting searches on “how to satisfy a woman in bed” and “how to do first night”. Chuckles aside, these searches make absolute sense. For example, 69% of marriages in India are still arranged. We infer that discussion on intimacy remains inhibited and it is easier to explore these topics online.
By analysing “how to” searches, we know what people are struggling with and how this varies across cultures. In the form of videos or other content types, brands can offer solutions and enable consumers in valuable ways.
Closing thoughts
Hopefully we have shed light on video viewers in Asia and some cultural traits. In the next part of this series, we distinguish between video formats and ad formats best paired with videos. We also weigh in on Facebook’s upcoming developments, including the 360 Surround camera and video search engine. For any questions about this research, feel free to give us a shout on Twitter @wearesocialSG or email us at [email protected].
Note: Not all South Asian markets were included in this research. For more information, please see footnotes below.
[i] Consumer Barometer (2014-2015). The Smart Viewer: What Type Of Connection Did People Use To Watch Online Videos During Their Last Online Video Session?. Retrieved from: https://www.consumerbarometer.com/en/graph-builder/?question=V19. Markets included were IN, ID, MY, PH, SG, TH, VN, HK, JP, KR, TW, AU, NZ.
[ii] Millward Brown (2016). Video Ad Reaction Study: Where They Watch Varies By Device. Retrieved from: http://www.millwardbrown.com/adreaction/video/#slide-7. Markets included were HK, IN, ID, JP, MY, NZ, PH, KR, TW, TH, VN. Percentages provided are averages across these markets.
[iii] Average volume of “How to” searches were obtained from Google Keyword Planner for the time period of January 2015 – January 2016. Markets included were HK, JP, KR, TW, AU, NZ, IN, LK, BD, MY, PH, SG, ID, TH and VN.