Digital 2027: Your guide to the evolving digital world
Reports
Digital 2027 is here! Our latest Global Digital Report is here and is packed with the latest digital milestones, trends, and insights. Here, Kepios & Manochi founder Simon Kemp takes us through the key headlines featured in Digital 2027.
More than 1 in 3 people using GenAI as adoption surges
It’s been 15 years since we published the first of our Global Digital Reports, but data shows that digital continues to gain momentum as we head into 2027.
And the good news is that our newest report has everything you need to make sense of all the latest trends.
Your complete guide to digital in in 2027
The Digital 2027 Global Overview Report – published in partnership between We Are Social and Meltwater – delivers comprehensive insights into the adoption and use of connected tech around the world.
Weighing in at more than 900 pages, this year’s report contains detailed statistics for:
Global internet adoption, access, and usage trends
AI adoption and use, including AI use cases and LLM platform trends
The evolution of online search and its role in the purchase journey
Social media behaviours and platform preferences
Mobile ownership and use
Ecommerce activity, including social commerce data
Digital entertainment, covering online TV and video, digital audio, and video games
Consumption of news content via digital channels
Online marketing trends, including ad spend and engagement
Essential digital headlines for 2027
Top stories in our flagship Digital 2027 report include:
An impressive milestone for GenAI use
The world’s most used AI platforms
Signs that web use may be in decline
Important changes in the use of search engines
The reasons why people use AI
AI’s role in the buyer journey
Continued growth for social media
The world’s top social platforms
Renewed enthusiasm for voice
The resurgence of email
And that’s not all: you’ll find a treasure trove of data, trends, and insights in the complete report, and we’ll also explore some fascinating findings in this extensive analysis article, so read on below.
The ultimate collection of digital data
Before we begin, I’d like to extend my heartfelt thanks to our wonderful research partners, who provide much of the world-leading data you’ll find in this report:
Simon has been producing the Global Digital Reports series for 15 years, so he’s intimately familiar with the global “state of digital”, and how people’s online behaviours are evolving.
As you explore this latest report – and especially as you compare trends over time – please be aware of the following:
International sanctions mean that GWI is no longer able to field its survey in Russia. As a result, we’ve removed data for Russia from the historical GWI figures that we’ve included in this report, to deliver more representative trends over time. That means all values on the GWI timeline charts you’ll find in this particular report already reflect these changes, but please refer to individual chart footnotes to understand how changes might affect this year’s data.
Similarweb recently introduced a new methodology for its App Intelligence dataset, which has resulted in some important changes to the figures the platform reports. Fortunately, the company has been able to apply these changes to historical data too, so – once again – the timeline trends you’ll find in this latest report already reflect these changes. However, readers should avoid comparing this new App Intelligence data with figures published in previous Global Digital Reports.
The United Nations made significant changes to its approach to classifying “urbanisation” since our Digital 2026 Global Overview Report, resulting in some big changes in reported values for urbanisation and urban population.
Please also refer to our comprehensive notes on data to understand other changes to data and sources in the Global Digital Reports series.
The complete report
You’ll find our complete Digital 2027 Global Overview Report in the embed below (click here if that’s not working), but read on past that to find our in-depth analysis of what this year’s numbers actually mean for you and your work.
Key stats: the global state of digital
Let’s start with a look at the latest global headlines:
The United Nations’ World Populations Prospects data shows that there are 8.32 billion people living on Earth today. That figure is 69 million higher than the total we reported this time last year, resulting in an annual growth rate of 0.8 percent. The UN’s data also illustrates humanity’s continued move towards urban societies, with 80.6 percent of the world’s population – more than 4 in 5 people – now living in towns and cities [note that the UN made fundamental changes to the way it classifies urban and rural populations in November 2025].
GSMA Intelligence’s latest research indicates that there are 5.86 billion unique mobile users around the world in October 2026, which equates to 70.4 percent of the global population. This unique subscriber figure has increased by 98 million over the past 12 months, equating to annual growth of 1.7 percent. Meanwhile, separate data from Ericsson shows that the 7.68 billion smartphones in use today account for roughly 89.6 percent of all active mobile phone handsets, and 85.8 percent of total cellular mobile connections [note that some people may use more than one smartphone].
Manochi’s analysis shows that the total number of people using the internet had reached 6.15 billion at the start of October 2026, which puts global internet penetration at 73.9 percent. Reported internet user figures have increased by 54 million (+0.9 percent) over the past year, but our analysis indicates that delays in reporting mean that the actual growth figure over the past 12 months is probably considerably higher than these numbers suggest. Despite continued improvements in internet access, however, close to 2.17 billion people around the world remained offline at the time of report production.
Manochi’s research also reveals that global social media user identities have now reached 5.81 billion, with that figure equivalent to 69.9 percent of the global population. This global user identities figure increased by 2.7 percent in the 12 months to October 2026, thanks to the addition of 151 million new user identities [note that “user identities” may not represent unique human individuals.]
According to Manochi’s latest analysis, there are now 3.24 billion active users of generative AI platforms. This figure equates to 38.9 percent of the total population, but – like our social media user identities figure – it’s important to stress that this GenAI user figure may not represent unique human individuals. Caveats aside though, active GenAI users increased by more than 1.2 billion between October 2025 and October 2026, resulting in an impressive annual growth rate of 57.2 percent.
But beyond overall adoption trends, how have people’s online behaviours and preferences been evolving?
Let’s explore the latest developments.
More than 1 in 3 people using GenERATIVE AI
Manochi’s latest analysis reveals that more than 1 in 3 people around the world now uses generative AI (GenAI) each month.
Our research indicates that 3.24 billion users will access at least one of the top LLM platforms in October 2026, equating to a worldwide adoption rate of 38.9 percent [learn how we calculate these numbers inthis article].
It’s important to stress that – while we strive to deduplicate figures across different platforms – the base user figures reported by the platforms themselves may include some degree of duplication, because the same individual may use multiple accounts on the same platform (e.g. one for personal use, and one for work).
As a result, we recommend treating this GenAI user figure in much the same way as our social media “user identities” figure.
But having said that, research conducted by GWI indicates that ChatGPT already had more than 1.1 billion monthly active users amongst adult internet users in Q2 2026, and once we factor age and geography, this finding correlates closely with the ChatGPT figures that we use in our calculations.
Growth in GenERATIVE AI use
Manochi’s analysis also indicates that monthly active GenAI users have increased by more than 57 percent over the past 12 months, thanks to the addition of 1.2 billion new users.
For perspective, figures reported by OpenAI indicate that ChatGPT alone has added roughly half a billionweekly active users over the past year, which our analysis suggests translates to an increase of roughly 700 millionmonthly active users.
And for added perspective, Similarweb’s App Intelligence data shows that active users of ChatGPT’s mobile apps have more than tripled over the past 2 years.
Meanwhile, CNNIC’s research shows that GenAI users in China have increased by at least 150 million over the past 12 months.
But perhaps the most interesting trend is the growth in “non-ChatGPT” platforms, especially Google’s Gemini and Anthropic’s Claude.
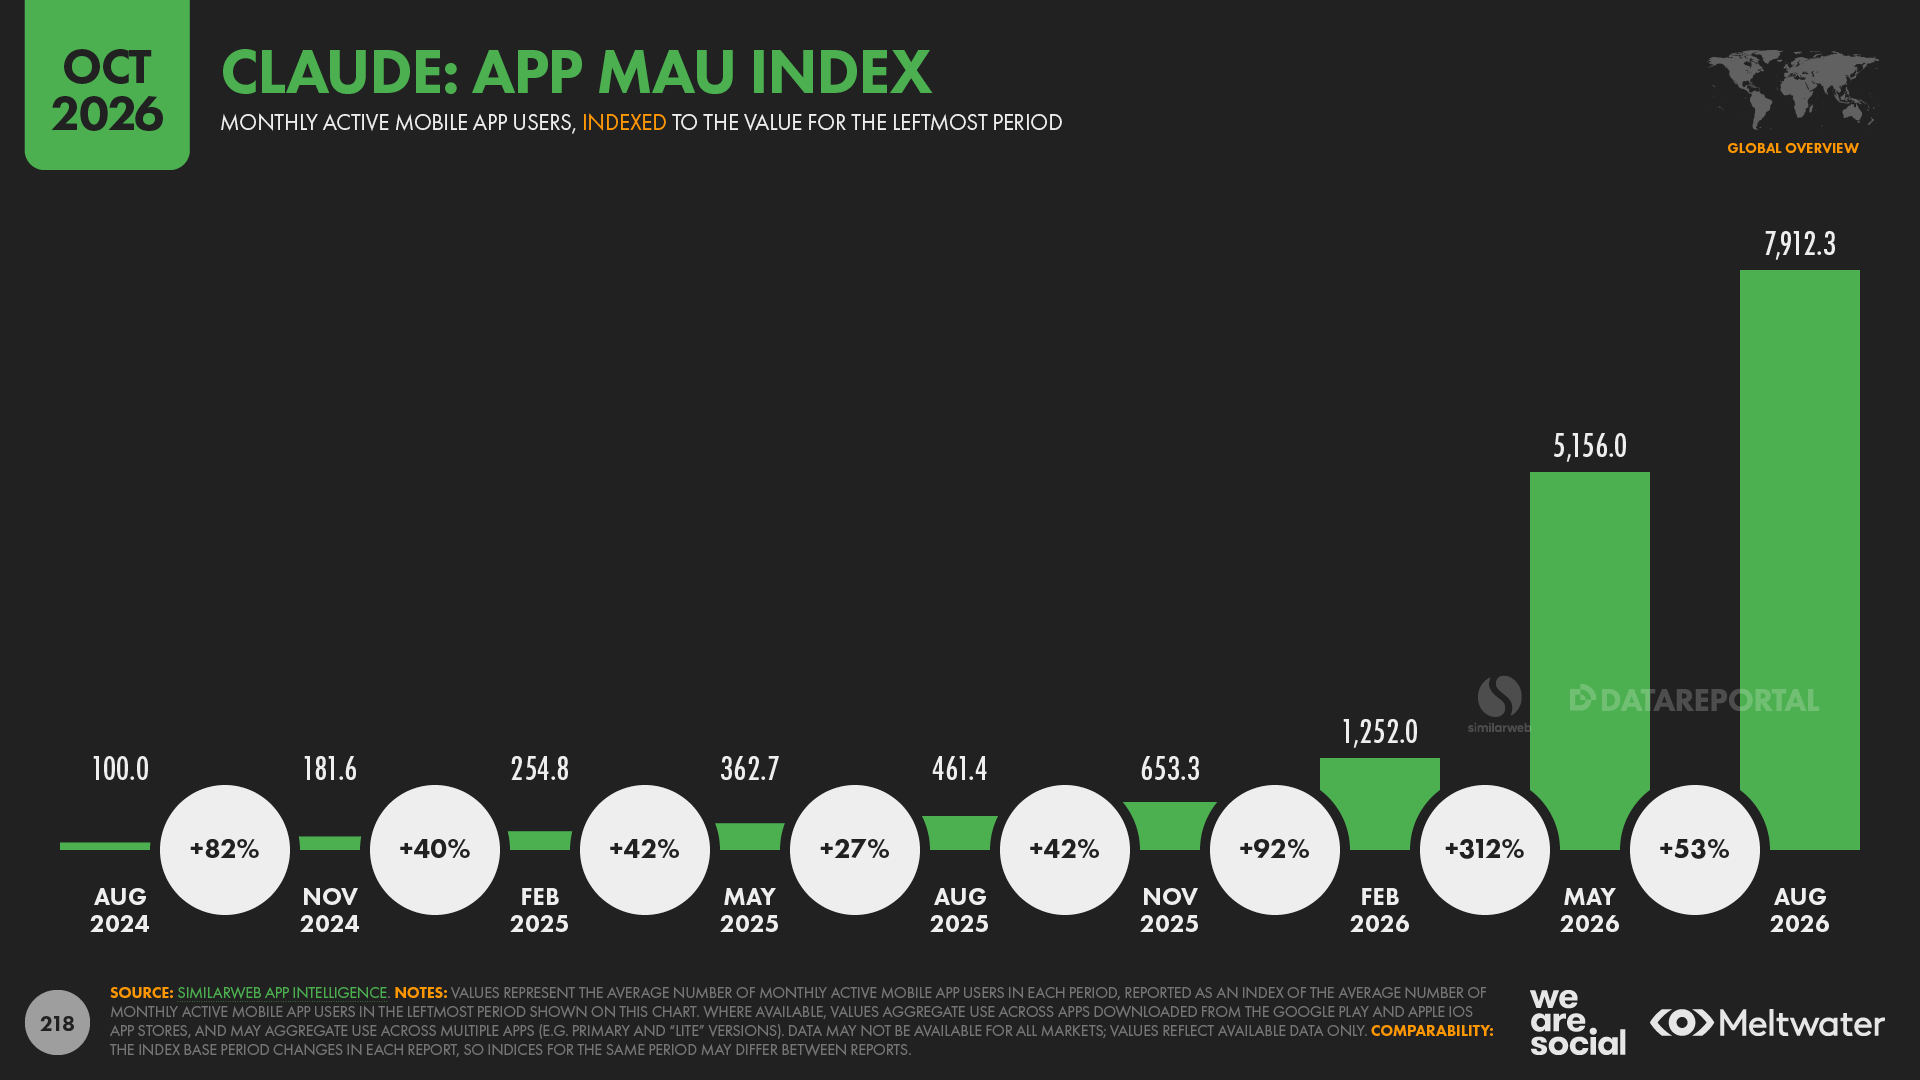
For example, Similarweb’s data shows that active users of Gemini’s mobile apps have increased more than fourfold over the past year, while Gemini’s app MAU figure for August 2026 is more than 23 times higher than the equivalent figure for August 2024.
Moreover, that figure only includes use of Gemini’s standalone mobile apps; if we were able to factor OS integrations too, that figure could easily be even higher.
Claude has delivered this year’s standout GenAI growth though, with Similarweb’s data indicating that the platform’s active app user figure for August 2026 was a whopping 17 times higher than the equivalent figure for August 2025.
And in an even more impressive achievement, Similarweb’s data suggests that monthly active users of Anthropic’s flagship app in August 2026 were almost 80 times higher than the equivalent user figure for August 2024.
Most used GenERATIVE AI platforms
So how does monthly use of these platforms compare?
Well, Similarweb’s latest data reveals that ChatGPT is still the clear GenAI leader as we head into 2027, with twice as many monthly active users as any other platform.
However, as we’ve just seen, both Gemini and Claude have made significant gains over the past few months.
Microsoft’s Copilot app also seemed to be gaining momentum, but the company’s recent announcement that it will merge its Copilot and Copilot 365 platforms suggest that Copilot’s future will focus more on enhancing Microsoft’s other products like Office, rather than acting as a standalone chatbot.
There’s no easy way to deduplicate platforms’ user bases across their web interfaces and native mobile apps, so we report these datasets separately, especially because each one tells a different story.
Top GenERATIVE AI mobile apps
Similarweb data indicates that mobile apps claim the lion’s share of GenAI activity today, which demonstrates just how quickly these platforms have become a fixture on our smartphones and in our daily lives.
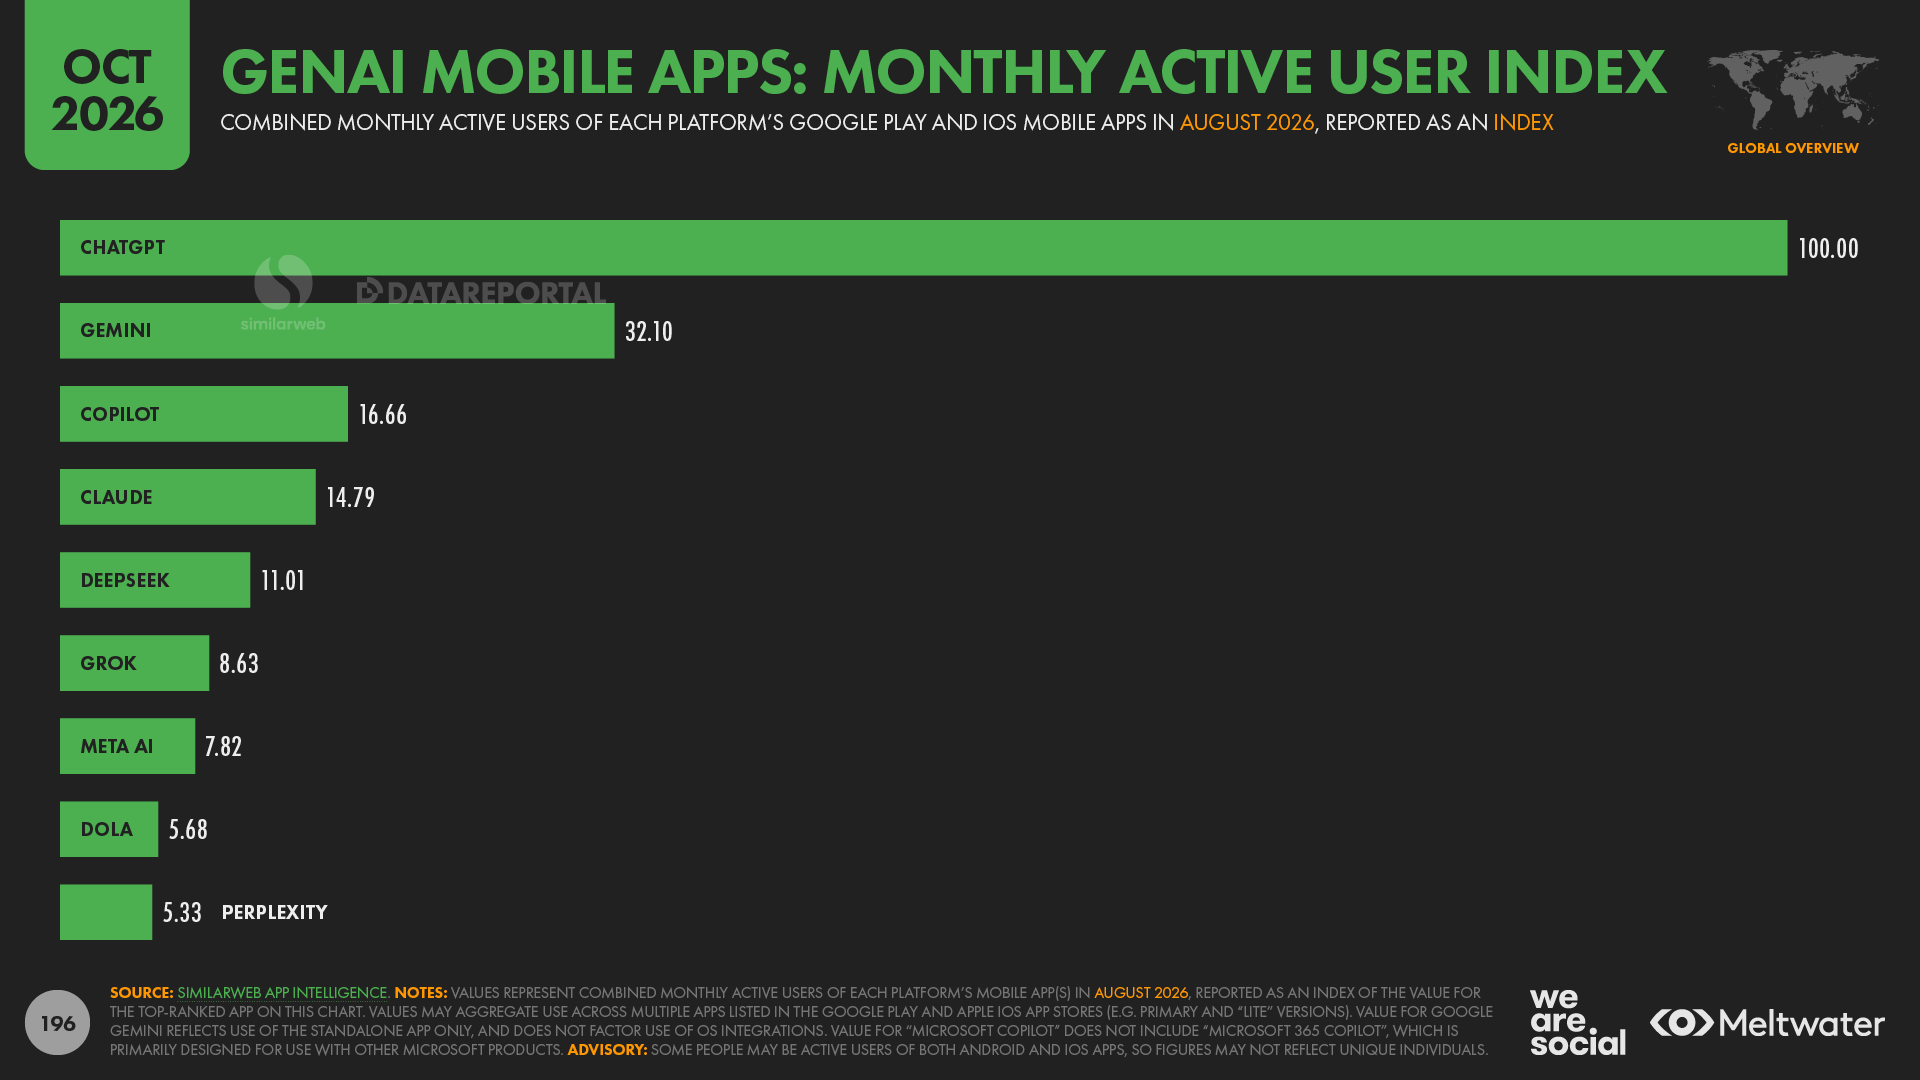
ChatGPT tops the latest rankings, with the platform attracting more than 3 times as many monthly active users in August 2026 as its next nearest rival, Gemini [but note that figures for Gemini use donotinclude AndroidOS integrations].
Copilot ranked third, with an indexed MAU value of 16.66, indicating that the platform’s mobile apps had six times fewer MAUs than ChatGPT did in August.
Claude ranked fourth in August 2026 with an index value of 14.79, while Deepseek rounded out the top 5, with an index of just over 11.
Note that these figures do not include data for China.
Use of GenERATIVE AI on the web
Meanwhile, figures for web use tell a slightly different story.
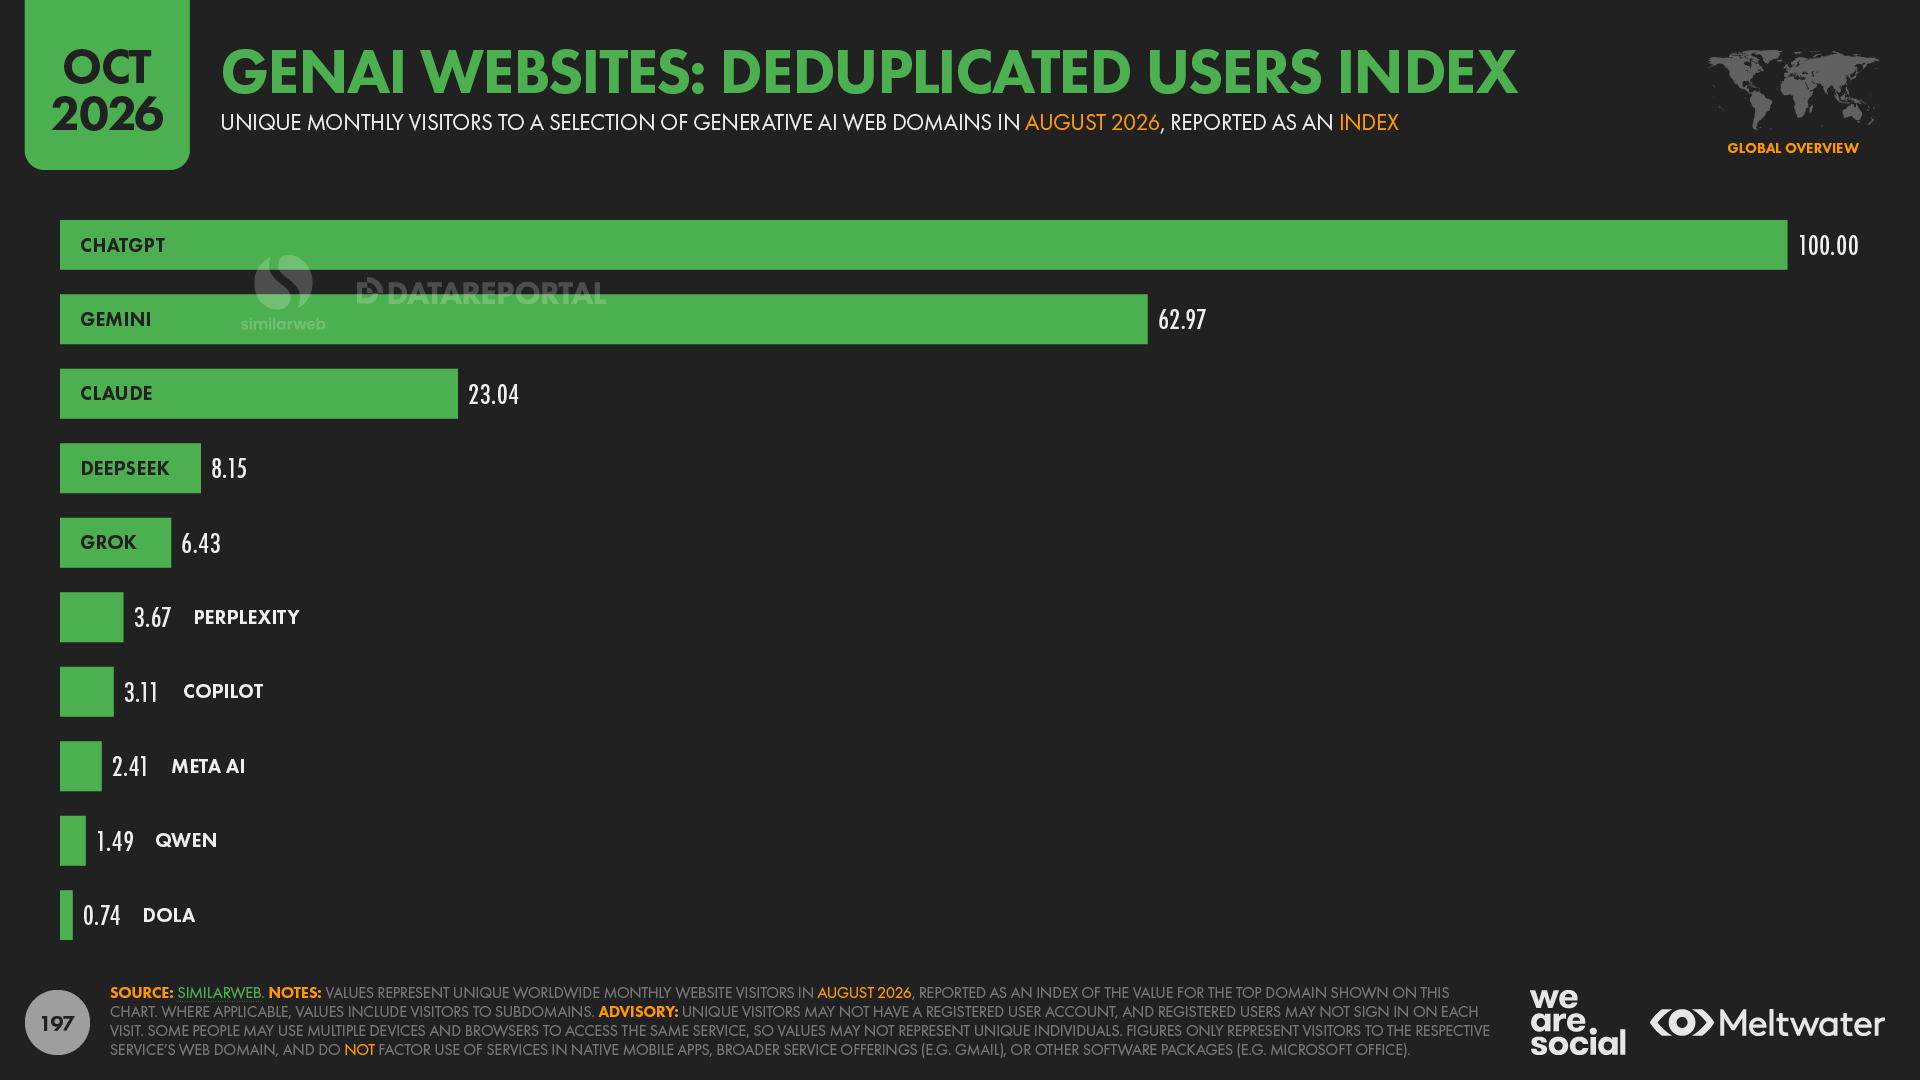
ChatGPT still claims top spot outside of China, but its lead over second-placed Gemini is considerably less than the lead we saw in the mobile app ranking.
Indeed, Gemini’s web user base is now over 60 percent as large as ChatGPT’s, and Similarweb’s data shows that Google has made significant strides in closing that gap over the past year.
Claude ranked third in Similarweb’s ranking of web-based GenAI platforms in August 2026, with its browser-based offering attracting close to a quarter the number of unique users as ChatGPT.com.
Deepseek claimed fourth spot, while X’s Grok platform closed out the top five.
However, Similarweb’s data indicates that both Deepseek and Grok had fewer than 10 percent of the monthly active web users that ChatGPT did in August 2026.
And it’s also interesting to note that Copilot falls further down this web ranking, which may help to explain why Microsoft has made such sweeping changes to its Copilot strategy.
The ebb of the web
Many of the questions I’ve been exploring with clients over recent months relate to AI’s impact on the web.
Given how frequently these questions come up – and how important they appear to be for digital practitioners across industries and geographies – we’ve used a rich Similarweb dataset to conduct an in-depth analysis of what’s been happening on the world-wide web over recent months.
You’ll find a summary of our top findings below, but if you’d like to dig deeper, you’ll find my complete analysis in this separate article.
Web traffic decimated
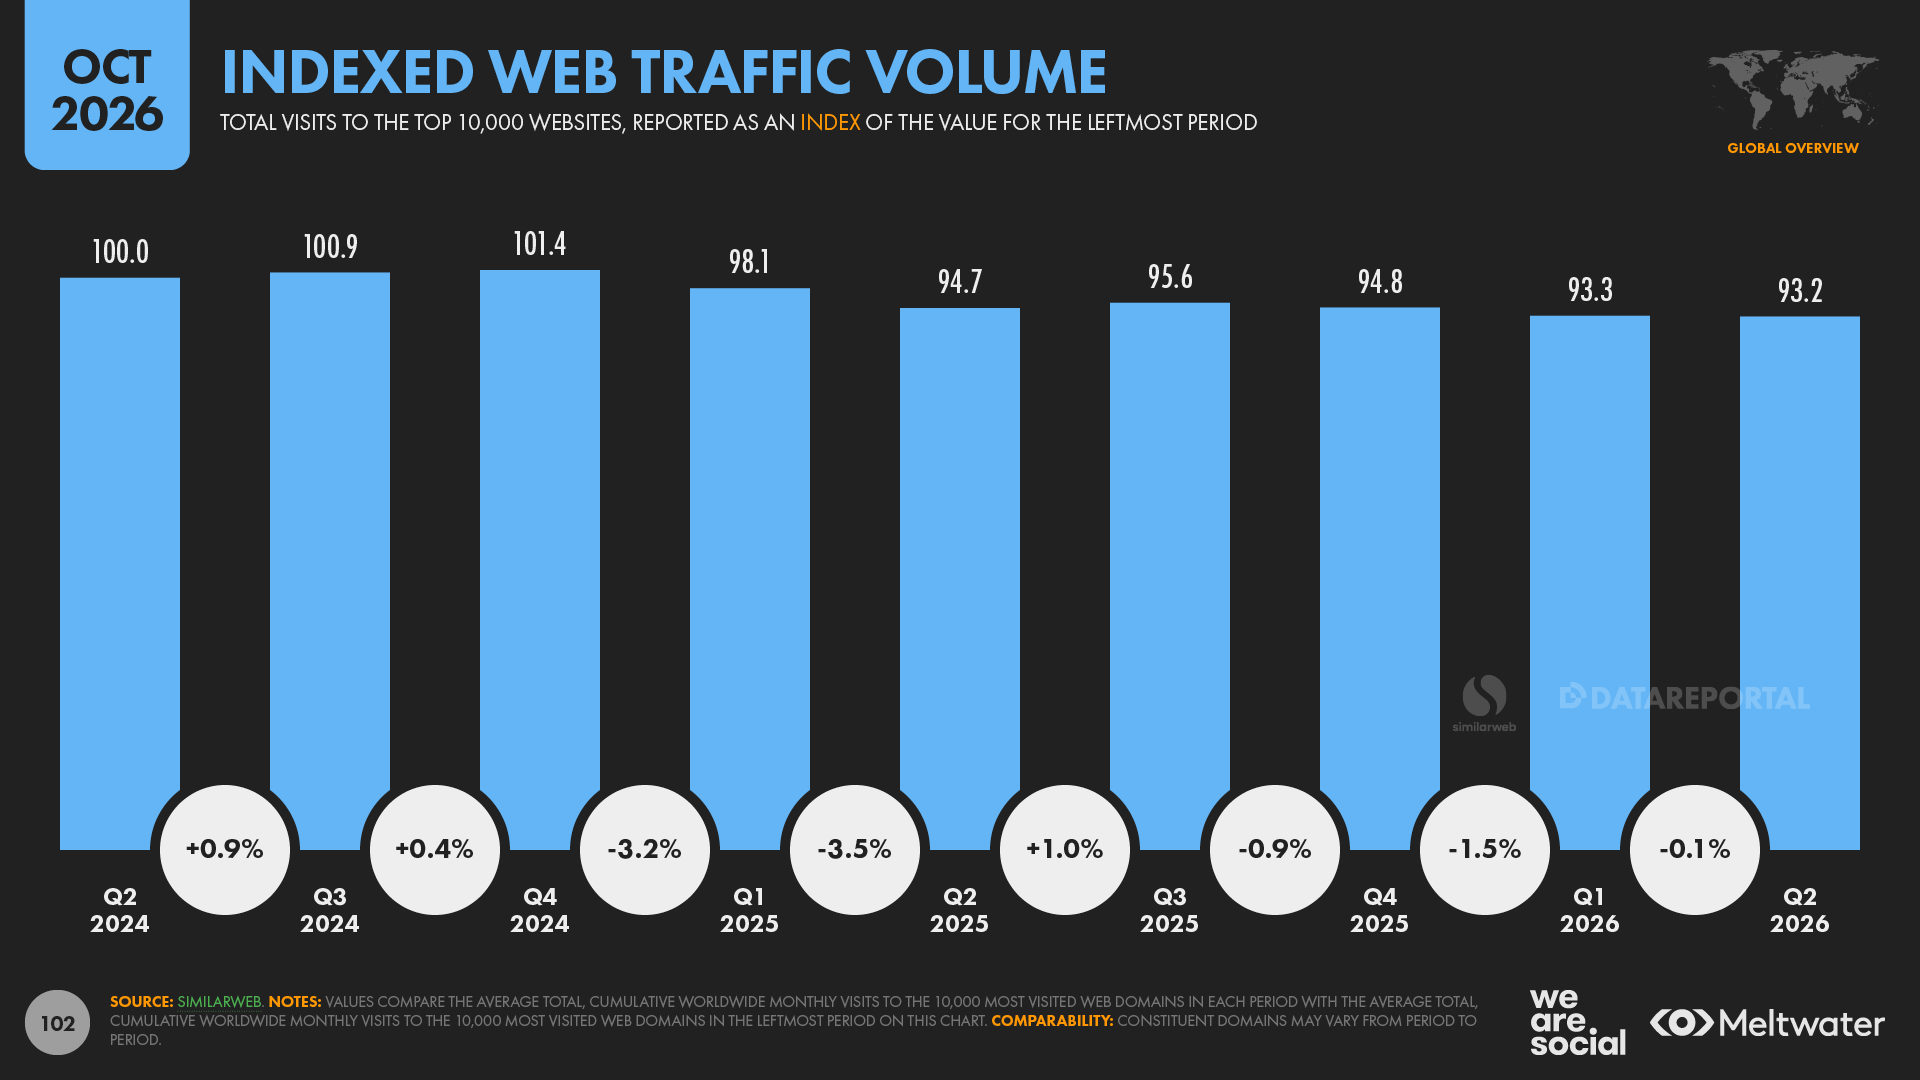
Across the world’s top 10,000 web domains, total monthly web traffic has declined by more than 10 percent since ChatGPT launched to the public in November 2022.
However, it’s important to stress that the rise of LLMs isn’t the only potential reason why web traffic is in decline, and in fact, my analysis suggests that people’s increasing use of native mobile apps is more likely the primary reason why web traffic has fallen so much over recent years.
And furthermore, Similarweb’s data shows that there was actually a brief resurgence in global web traffic during the second half of 2024.
Total web visits started to decline again at the start of 2025 though, and figures show that traffic is now 6.8 percent lower than it was this time two years ago.
To help make sense of that figure, it’s worth noting that combined traffic across the top 10,000 web domains fell by almost 50 billion visits per month between Q4 2022 and Q2 2026.
So, while it’s important to continue monitoring short-term fluctuations, data clearly confirms that web traffic is declining.
Decreasing time
But the time that the world spends using the web is falling even faster than visitor numbers, with Similarweb’s data revealing an 11.2 percent decline in the total time spent visiting the world’s top 10,000 domains in just the past 24 months.
To put that figure in perspective, the total time spent across the top 10,000 websites has fallen by more than 6.6 billion hours per month in just two years, which equates to the loss of roughly 760,000 years of cumulative web time each month.
And for added perspective, total web time has declined by close to 16 percent since ChatGPT’s launch at the end of 2022.
This decline in total time spent has been exacerbated by a shortening of average visit times.
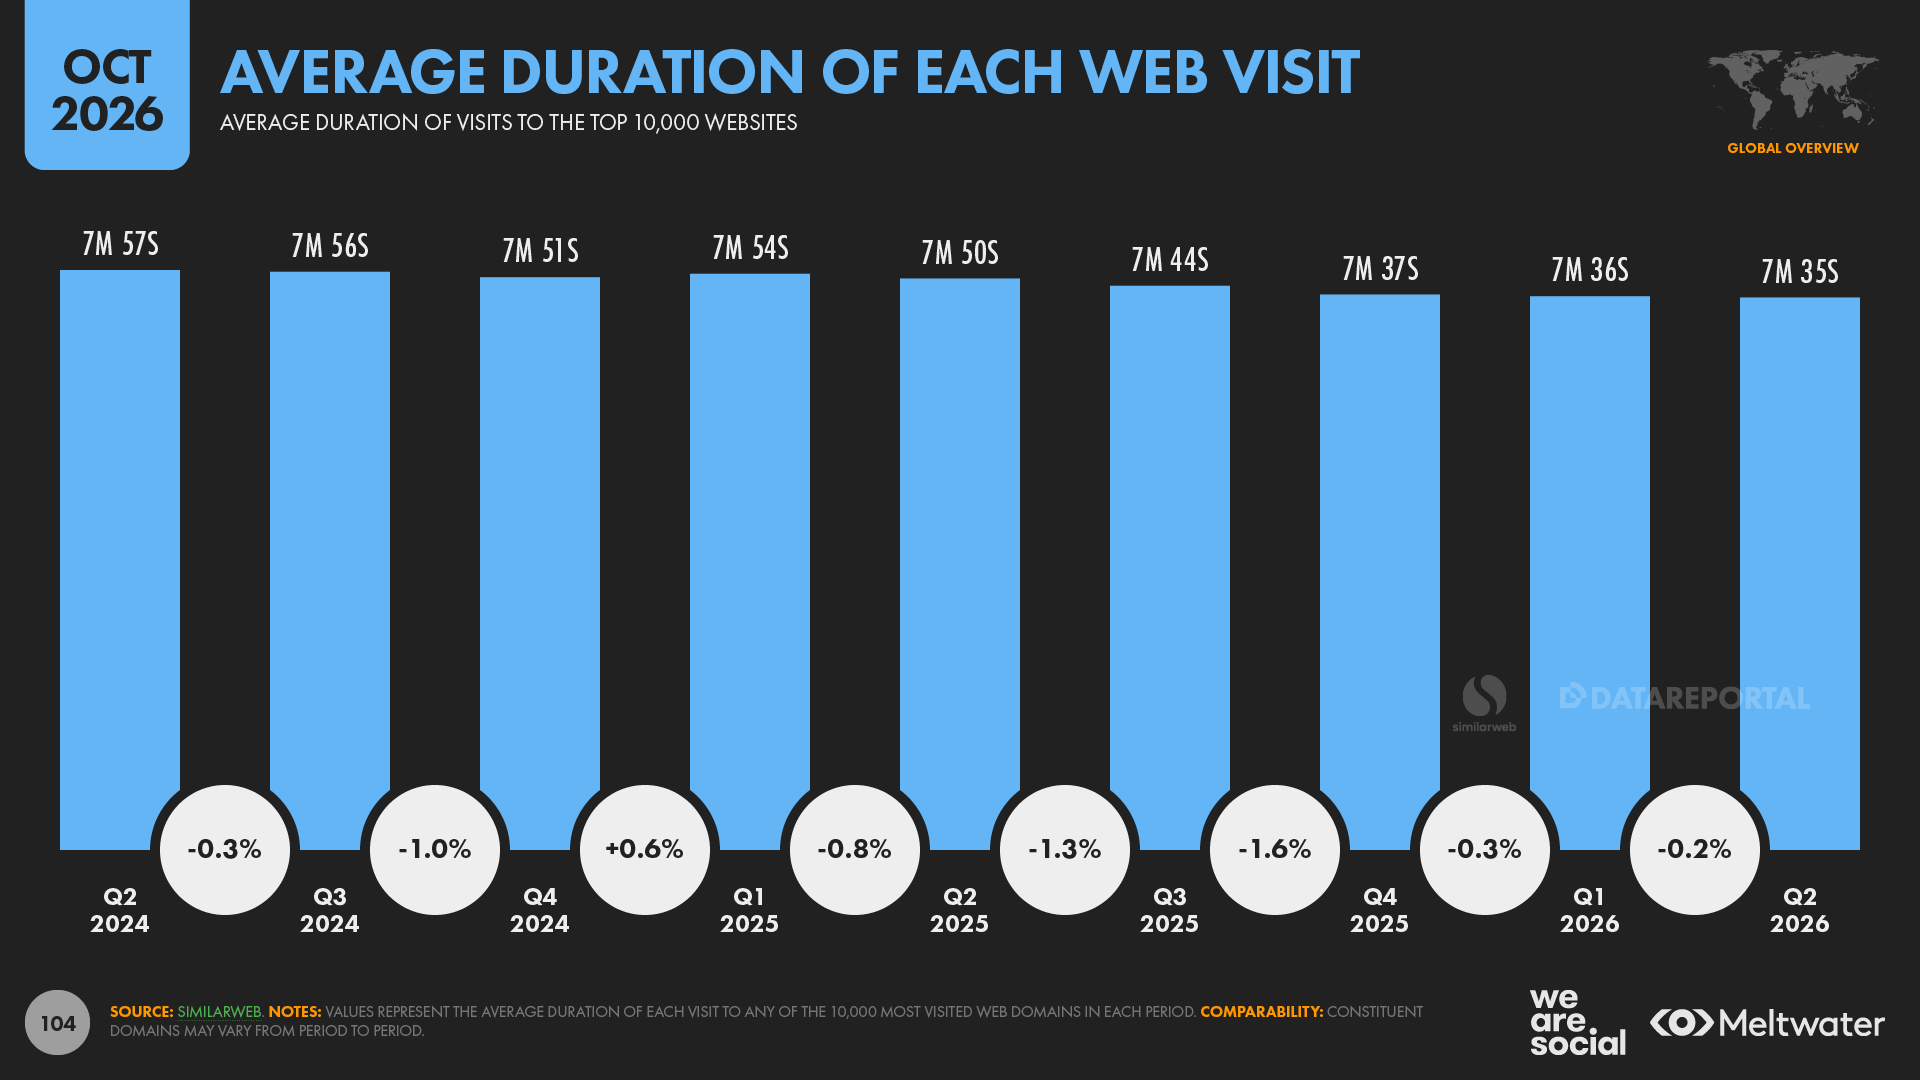
As you might expect, the average duration of visits to different websites can vary significantly, but if we look at the overall averages across all domains in Similarweb’s ranking of the world’s 10,000 most visited domains, we see that average session time has fallen by roughly 5 percent over the past two years.
During the second quarter of 2024, the typical web visit lasted just under 8 minutes, but by the second quarter of 2026, that average had fallen to just over 7½ minutes, resulting in a reduction of close to 30 seconds per visit in just two years.
Page views counter the trend
But in a somewhat surprising contrast to these trends, the total number of web pages viewed each month has actually increased over the past 24 months.
Similarweb’s data indicates that web users loaded an average of just under 3 trillion pages per month across the world’s top 10,000 domains in the second quarter of 2026, with that figure up by more than 2 percent compared with the same period in 2024.
Moreover, the average number of pages viewed per web visit has increased over recent months, with the current average of 7.18 pages per visit representing an increase of close to 10 percent compared with Q2 2024, when the average stood at 6.54 pages per visit.
And it’s also interesting to note that average page view figures saw a meaningful increase at the start of 2025, despite that being the period during which we saw a return to declines in overall web visits.
Digging deeper: web share by device
Looking more closely at trends by device, the data provide support for the hypothesis that the rise of native mobile apps has played a primary role in evolving web activity.
Similarweb’s figures show that total desktop visits actually fell by less than 1 percent over the past two years, compared with an 11 percent drop in visit figures for mobile traffic during that same period.
Moreover, absolute desktop visits have actually increased over the past 12 months, suggesting that many of the changes we’ve explored so far can be attributed to changes in web activity on our phones.
As a result of these trends, desktop’s share of overall web traffic has been creeping back up over recent months, but – with a 57.5 percent share – mobile devices still account for the majority of the world’s web traffic.
Impact on advertising
The overall decline in web traffic has important commercial implications too, with Similarweb market intelligence offering valuable insights into how recent changes might affect web advertising.
The company’s data indicates that just under a third of websites that ranked amongst the world’s 10,000 most visited domains in Q2 2026 use Google AdSense, which is one of the most widely used advertising products on the web.
It’s important to highlight that AdSense is only one of the many options available to publishers when it comes to monetising their web properties, and furthermore, Similarweb’s data only identifies whether a site uses Adsense – not whether the site features AdSense placements on each page, or how many such ad units it includes per page where it does them.
However, as long as we’re conscious of these caveats, Similarweb’s AdSense data provides a valuable reference for trends in traffic to ad-supported websites.
And – somewhat alarmingly – data shows that domains that use advertising products have seen their traffic fall more than twice as quickly as the overall web average.
More specifically, whereas Similarweb’s data puts the average decline in total visits across all of the top 10,000 websites at 6.8 percent over the past two years, the company’s figures suggest that visits to sites that use AdSense have declined by 14.8 percent.
And moreover, if we remove YouTube from Similarweb’s AdSense dataset, that decline accelerates to 18.7 percent, suggesting that sites across the open web that feature advertising may have lost close to 1 in 5 monetisable visits over the past two years.
Bad news for brands
For clarity, there is absolutely no indication that the use of advertising products like AdSense might have played a role in declining traffic trends, and our reporting of this data is designed to illustrate the growing challenges faced by web publishers in today’s online environment.
But these trends don’t just affect content creators; they also have grave consequences for marketers.
Indeed, Similarweb’s data points to a decline of 35 billion monthly page views across sites that incorporate AdSense over the past two years.
And with most web publishers including more than one AdSense unit on each page, these changes could easily translate to the loss of trillions of ad impressions each year – and that’s only factoring the world’s top 10,000 domains.
For context, Statista reports that marketers are on track to spend almost US $200 billion on banner ads in 2026, while GWI reports that 22 percent of online adults say that they discover new brands, products, and services through ads on websites.
As a result, this reduction in advertising inventory translates directly to a significant reduction in proven opportunities for marketers.
But talking of how people discover brands and evaluate potential purchases, how have recent developments across the digital landscape been influencing the purchase journey?
Top channels for brand discovery
GWI’s latest research indicates that search engines remain the top channel through which online adults discover new brands, products, and services, with 32.0 percent of worldwide respondents identifying this channel.
TV ads ranked second in Q2 2026, with 30.6 percent of respondents choosing this option, while social media ads ranked third, at 30.4 percent [note that respondents could choose more than one option].
However, with even the top channel only cited by 32 percent of adult internet users, it’s important to highlight that no single channel reaches the threshold of introducing even 1 in 3 of the world’s online consumers to new brands.
And this finding emphasises the continued importance of – and arguably an ever greater need for – a varied marketing mix.
Indeed, GWI’s data indicates that the typical online adult now relies on an average of 5.82 channels to find new brands, with this current figure more than 4 percent higher than the average we saw this time two years ago.
Moreover, the mix of channels that people select reinforces the need for a balance between online and offline activities, with neither digital nor traditional marketing channels capable of delivering the best results on their own.
At this point, it’s important to highlight that the number of answer options included within this question in GWI’s survey has increased over time, which may influence the average number of answers that people select.
However, that increase in answer options is the direct result of increases in the number of channels that may introduce people to new brands, so I believe that this survey evolution actually makes these findings more representative of people’s real-life purchase journeys, not less.
And talking of new additions, it’s worth highlighting that artificial intelligence only just makes it into the top 15 channels when it comes to brand discovery, with 17.0 percent of online adults saying that they encounter new brands, products, and services via AI.
For comparison, and with particular reference to the previous section of this article, it’s worth noting that people are nearly 30 percent more likely to say that they discover brands via banner ads than they are to discover new options via AI.
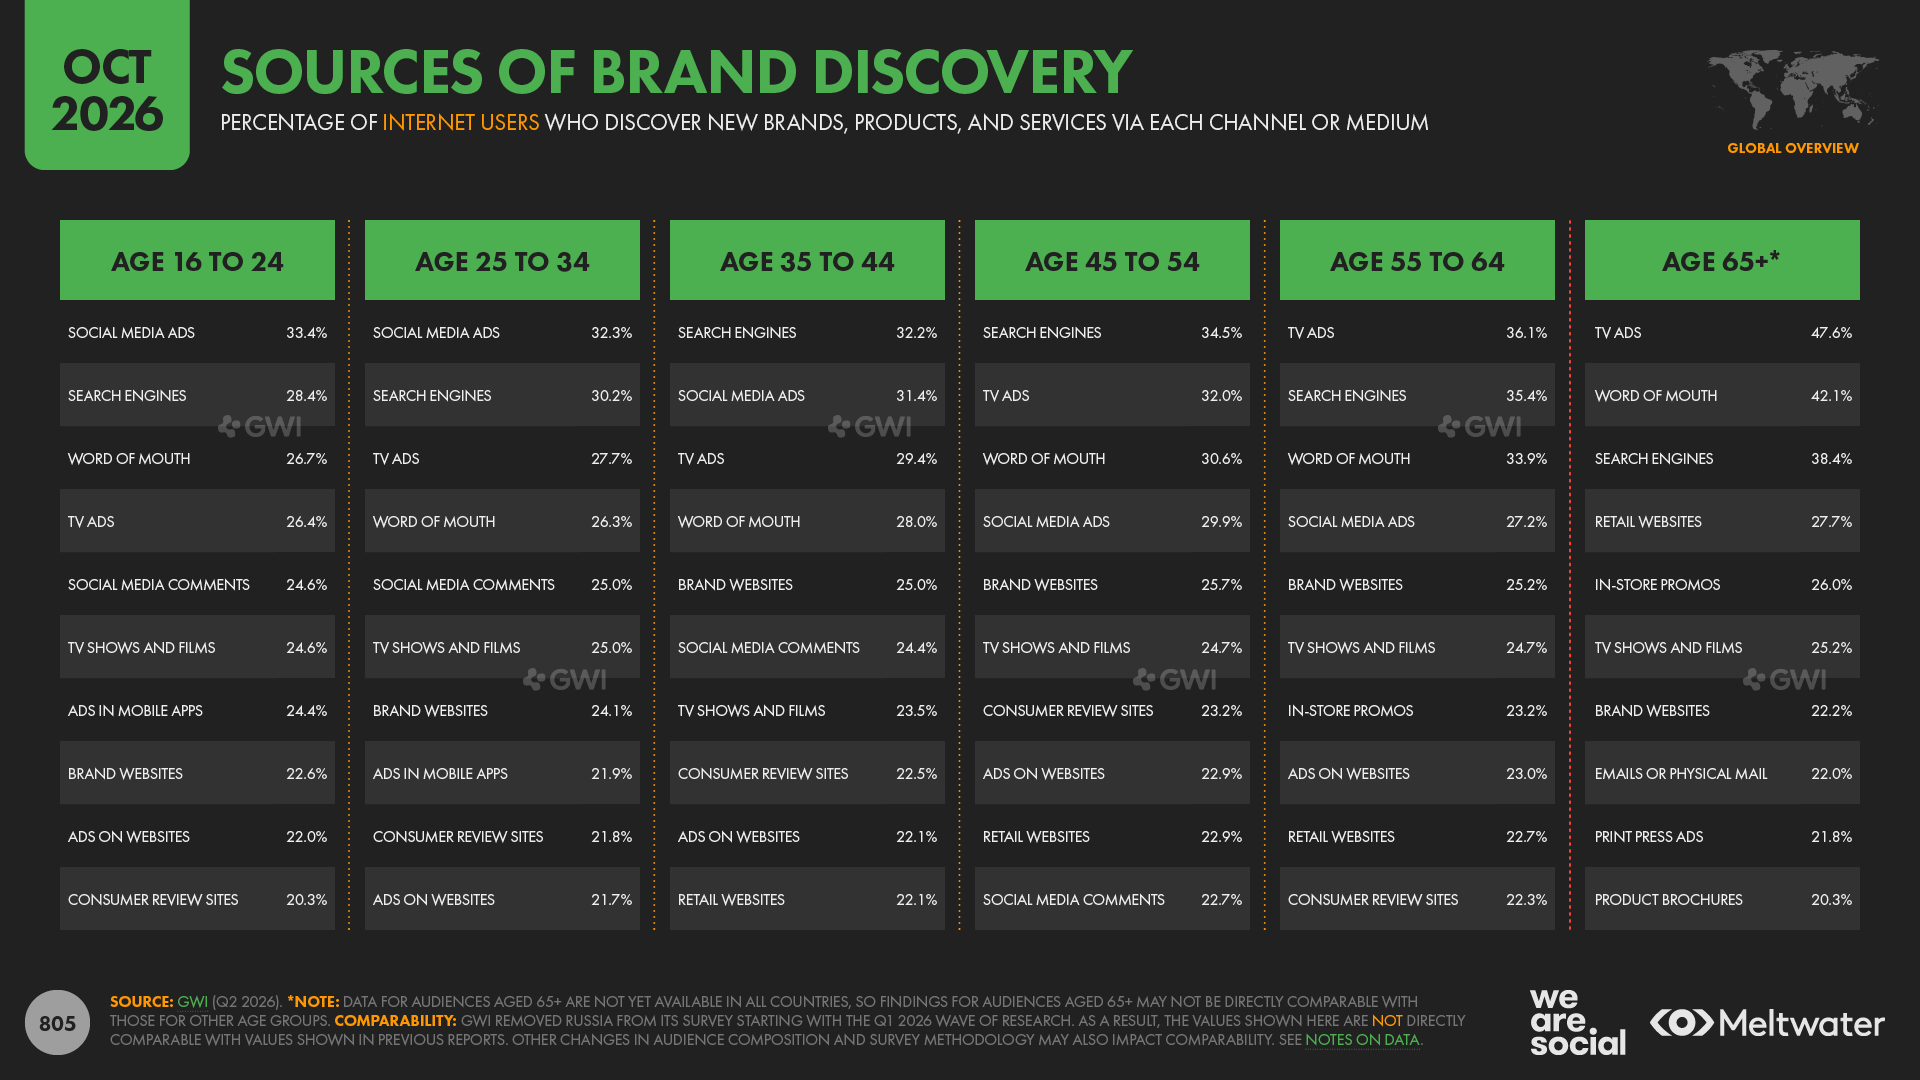
And even when we focus on younger audiences, just 20 percent of internet users aged 16 to 24 say that they first encounter brands via AI, which isn’t enough to rank this channel within their top 10 sources of discovery.
However, these figures don’t tell the whole story on their own, and GWI’s data also reveals that the overall number of people identifying AI tools as a source of brand discovery has increased by a full percentage point in just the past 3 months, equating to relative quarter-on-quarter growth of 6.3 percent.
Moreover, AI’s influence increases dramatically when we move to subsequent stages of the buyer journey.
Primary destinations for brand research
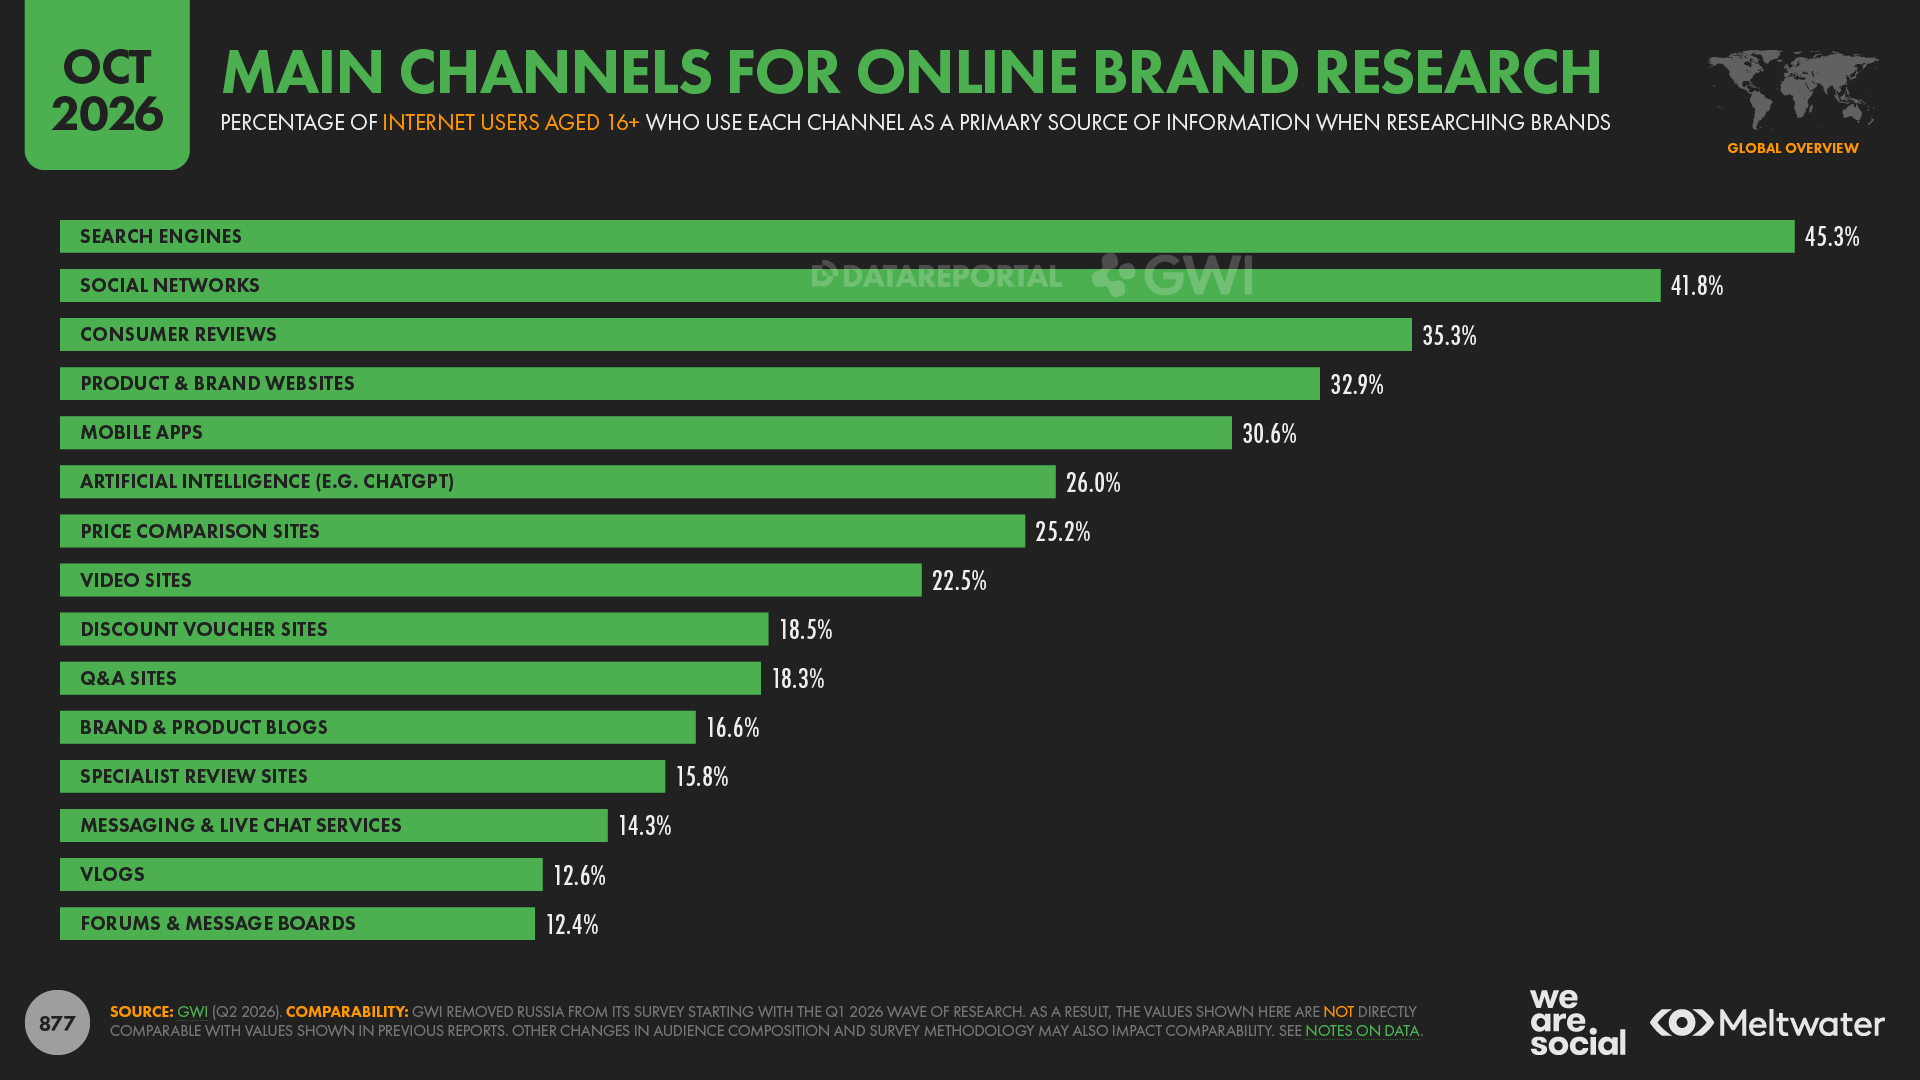
For example, GWI’s data reveals that artificial intelligence now ranks sixth amongst the channels that online adults use when researching potential purchases, with 26.0 percent of survey respondents selecting this answer option [note that people could again choose more than one channel in their answer].
However, search engines remain people’s top destination for brand research, with 45.3 percent of online adults selecting this answer option in GWI’s most recent global survey.
And for comparison, despite AI’s impressive momentum, online adults are still 74 percent more likely to visit search engines when researching brands than they are to visit an AI platform.
Social networks are also a more popular choice than AI, with 41.8 percent of respondents saying they turn to social channels when evaluating potential purchases.
And critically, product and brand websites are still more popular destinations than LLMs when researching brands too, with just under 1 in 3 respondents – 32.9 percent – selecting this answer option.
Once again though, GWI’s findings illustrate the importance of a mix of channels that can reach shoppers during the evaluative stages of a buyer journey.
More specifically, respondents selected an average of 3.8 channel options in answer to this question in Q2 2026, with that average roughly 4.1 percent higher than the equivalent figure for two years prior.
As we saw in the data for brand discovery though, the channels that people turn to for brand research vary meaningfully by age.
For example, social networks are the destination of choice amongst internet users aged 16 to 24, with 46.9 percent of this cohort identifying platforms like Instagram and Facebook as a source of information when researching brands.
Conversely, social networks only rank sixth for internet users aged 65 and above, with this age group more than 4 times more likely to use search engines to research potential purchases than they are to use social media.
It’s interesting to note that artificial intelligence already ranks amongst the top 10 destinations for brand research across all age groups, but use ranges from a high of 31.6 percent amongst users aged 18 to 24, to just 10.0 percent amongst users over the age of 65.
AI brand research by country
The propensity to use AI tools when researching potential purchase also varies meaningfully by geography.
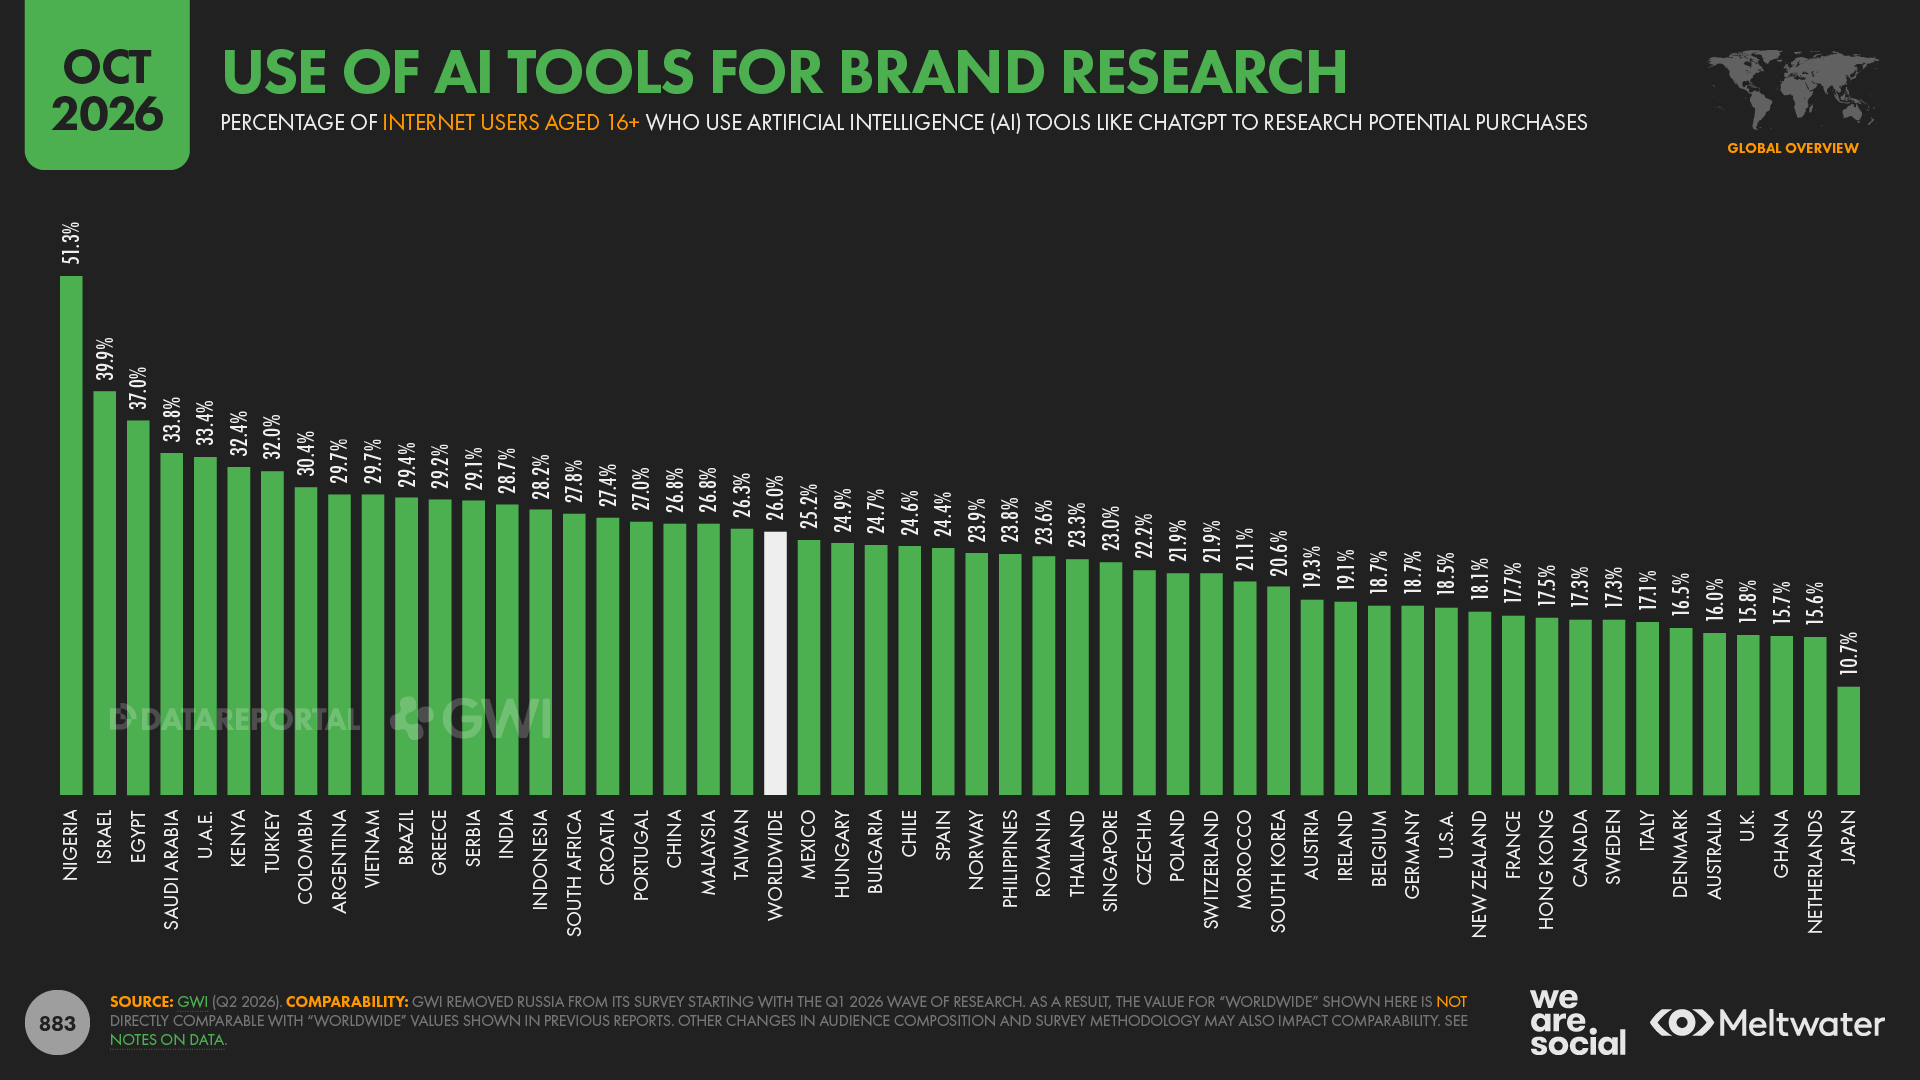
At the top end of the scale, more than half of Nigeria’s adult internet users (51.3 percent) say that they use AI tools to research potential purchases, while the same is true for roughly 4 in 10 Israelis (39.9 percent).
We also see elevated levels of AI brand research across other countries in the Middle East, with more than 1 in 3 respondents in Egypt (37.0 percent), Saudi Arabia (33.8 percent), and the UAE (33.4 percent) citing this channel.
Things look very different at the other end of the spectrum though, with just 10.7 percent of online adults in Japan saying that they use artificial intelligence when evaluating brands and purchases.
Usage rates are also relatively subdued across most of Europe and North America, with figures in many of these countries remaining well below 20 percent.
AI brand research by gender
Returning to demographics, it’s interesting to note that men are meaningfully more likely than women to use AI to research potential purchases.
Across GWI’s worldwide survey audience, 27.6 percent of male respondents say that they use artificial intelligence for brand research, compared with 24.3 percent for women.
Moreover, this gap persists across age groups, even though women are more likely than men to say that they conduct online research (using any digital channel) prior to making a purchase.
AI research: agency vs agentic
However, as Manochi has been discovering through a series of proprietary studies into how people actually use AI when preparing to make a purchase, most people aren’t yet at the stage where they’re delegating decision making to AI, let alone outsourcing actual transactions to fully autonomous agents.
Indeed, the shoppers in our studies still appear to be highly engaged with the process of brand research and the selection of individual products, even if they’re relying ever more heavily on AI tools to help them make sense of all the options.
More broadly, Manochi’s research also demonstrates that people’s AI behaviours are evolving rapidly, and that different individuals often adopt completely different approaches to exploring a particular product category or purchase.
We’re looking forward to sharing more of our findings from this research in future reports, but please get in touch if you’d like to discuss running one of these studies for your brand.
What people use AI for
But researching potential purchases is just one of the many uses people have found for AI, and it’s not the top motivation, either.
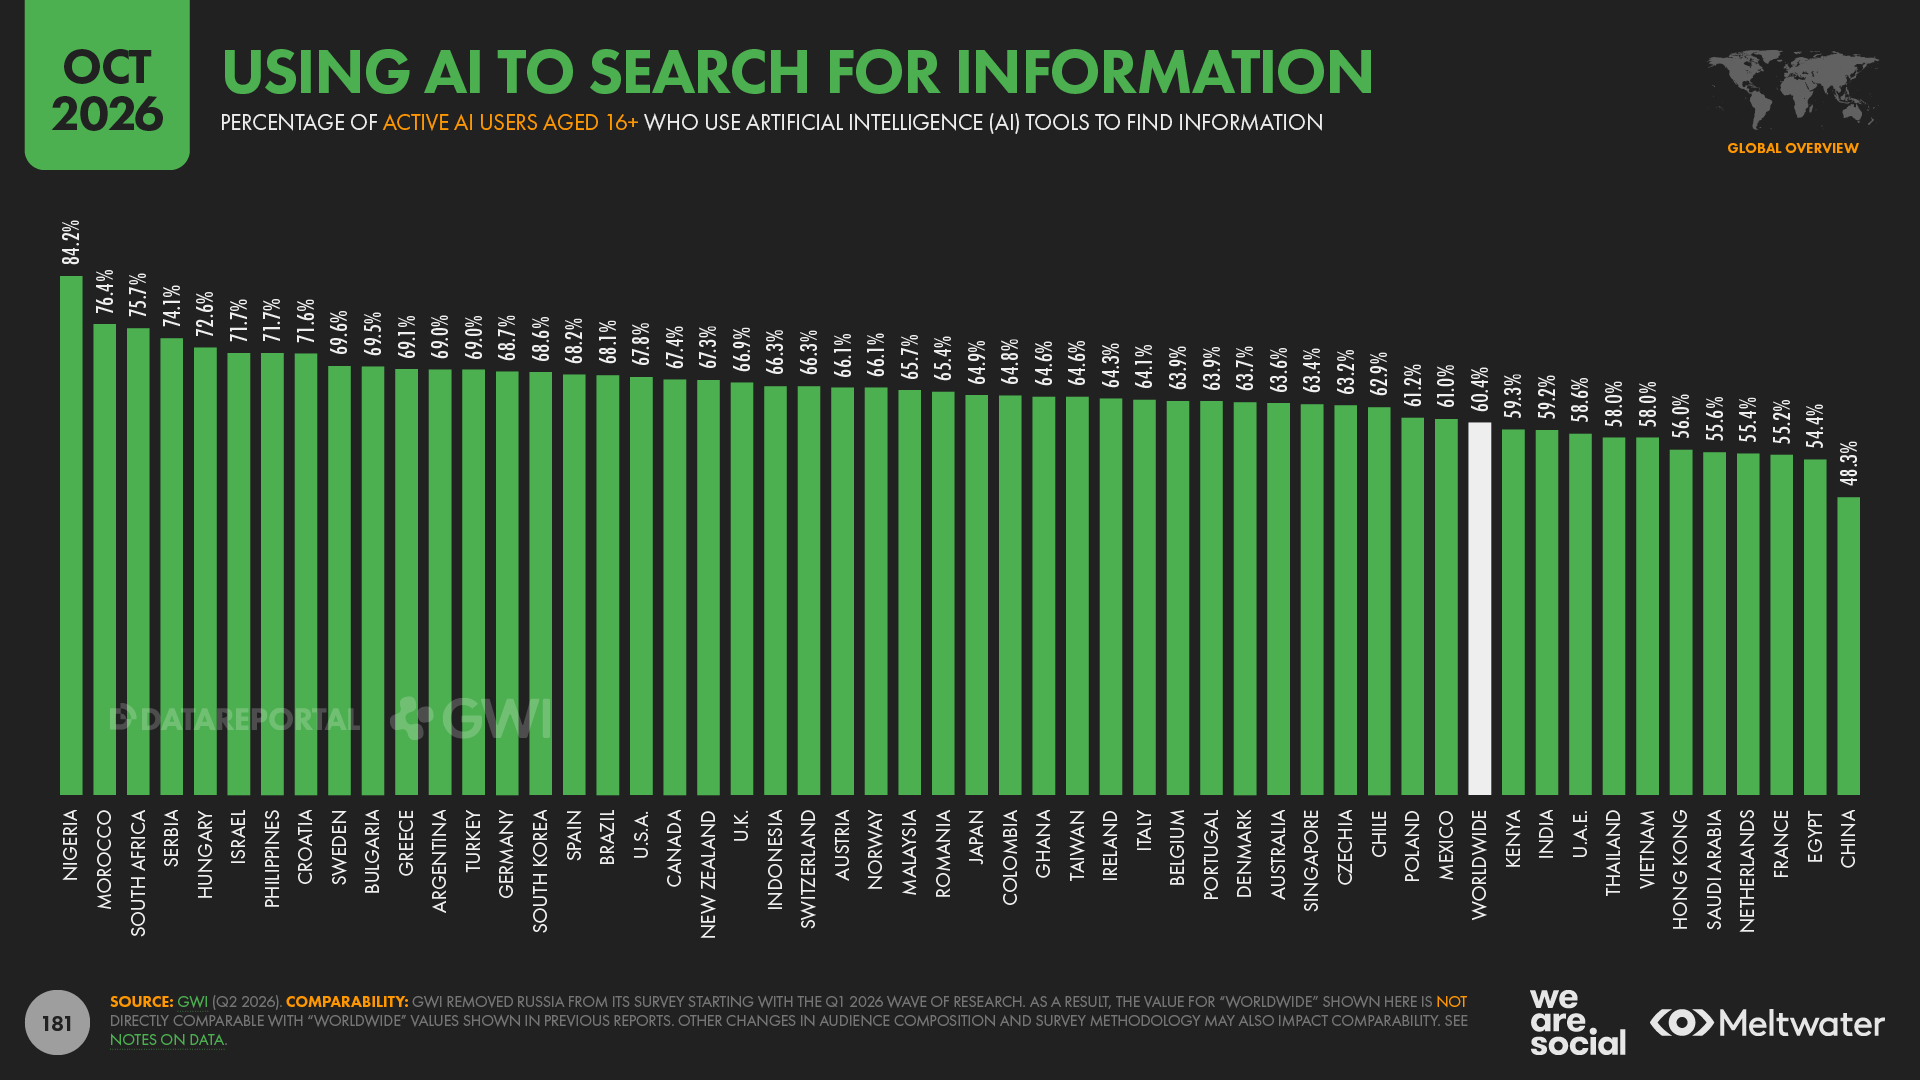
And in fact, as we see with broader internet motivations, “finding information” ranks as the most frequently cited motivation for using AI tools.
Indeed, across geographies and demographics, GWI’s most recent wave of research finds that more than 6 in 10 active AI users turn to AI tools for this particular purpose (60.4 percent).
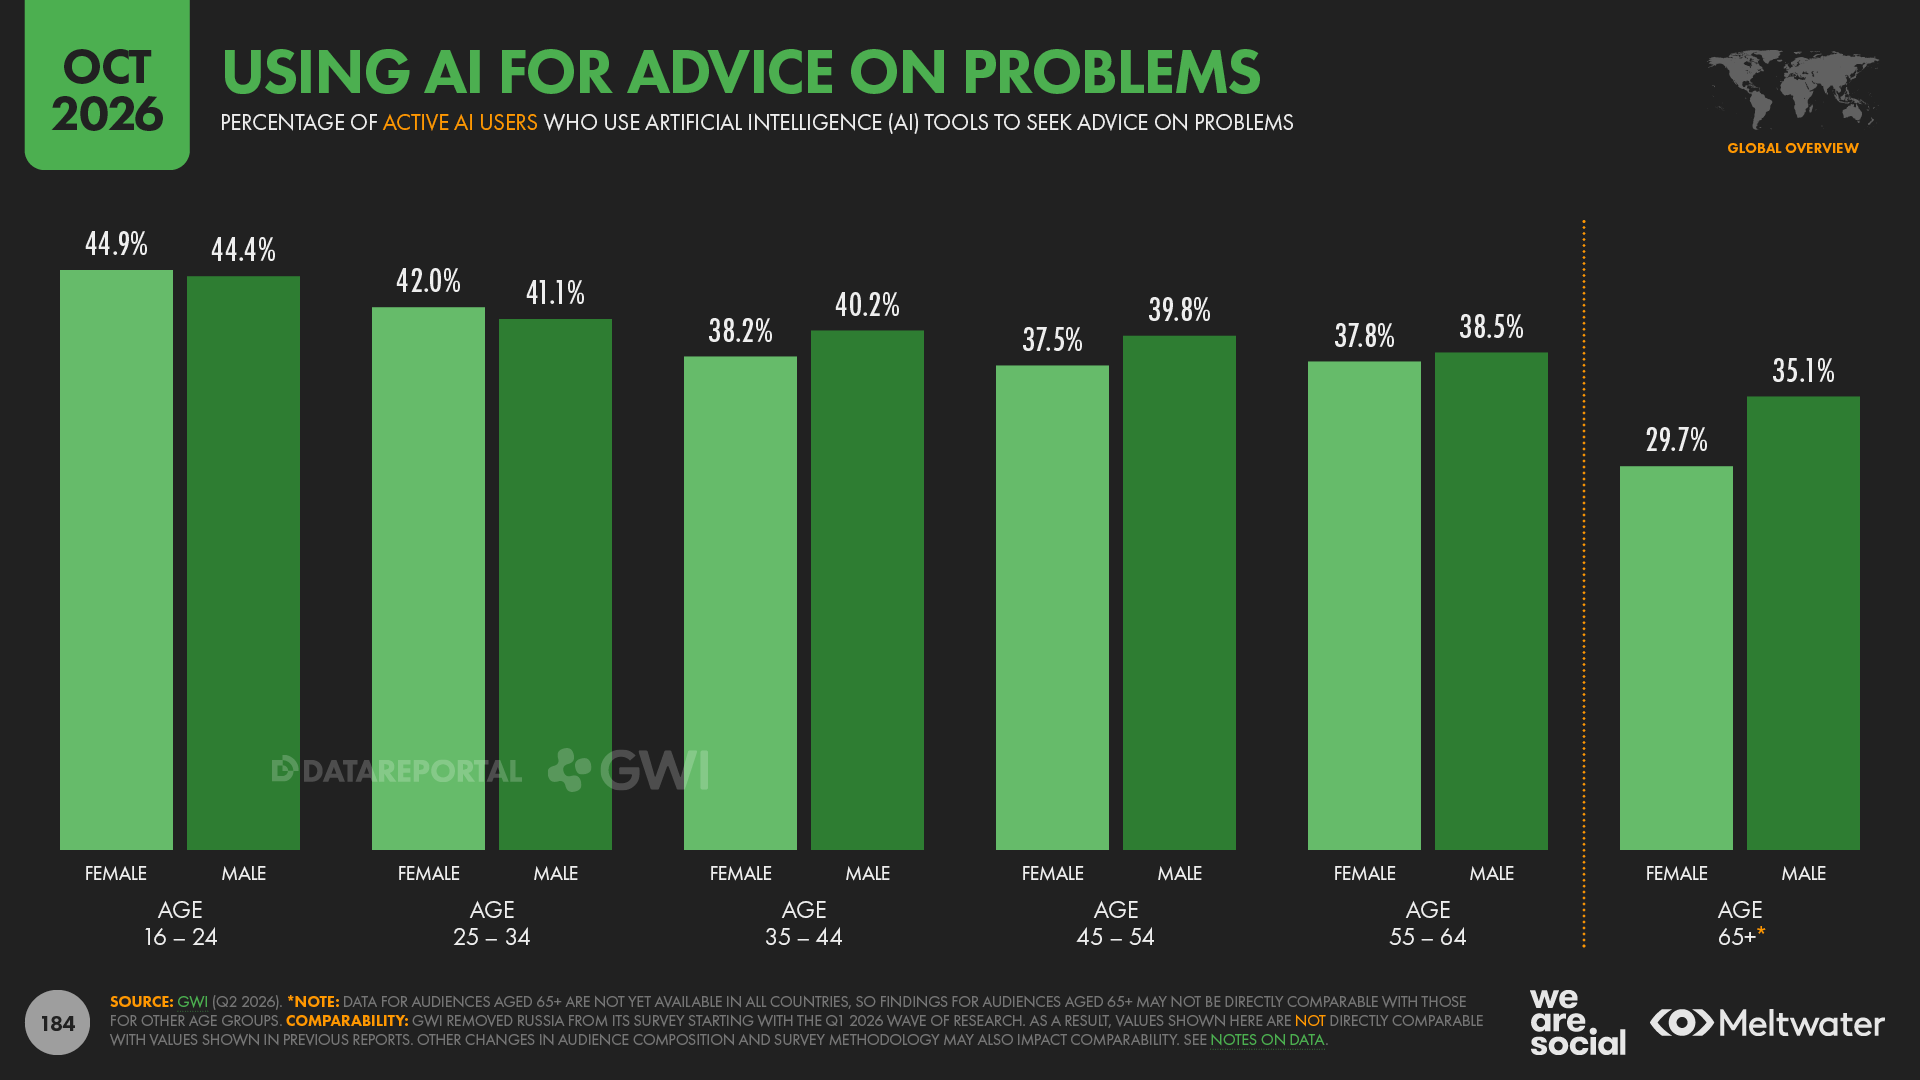
“Getting advice on problems” ranks second with 40.6 percent, and this is a particularly interesting finding, because it helps us make sense of how people view AI’s role in their lives (more on this in a moment).
“Learning or improving skills” places third amongst the answer options presented in GWI’s survey, with 38.4 percent of active AI users identifying this as a primary reason for using AI.
It’s also interesting to note that more than a quarter of AI users cite “entertainment” as one of the main reasons why they use these tools today.
AI motivations by country
Looking more closely, one of the most important findings in GWI’s data is that AI motivations vary meaningfully by culture.
For example, active AI users in Saudi Arabia are more than twice as likely as their peers in Denmark to use AI to monitor or improve health and wellbeing (29.1 percent versus 13.6 percent, respectively)
Similarly, AI users in Morocco are more than three times more likely to use AI for entertainment compared with AI users in Poland (40.1 percent versus 13.2 percent).
And given local differences in the tools that people can access, it’s particularly interesting to see that AI motivations in China are markedly different from those that we see elsewhere.
For example, while “finding information” remains the top motivation, China is the only country in GWI’s survey where fewer than half (48.3 percent) of active AI users cite this as a primary reason for using AI.
On the other hand, compared with users in other countries, China’s AI users are proportionately more likely to cite getting personalised recommendations, managing health and wellbeing, and using AI to save time and increase efficiency.
AI motivations by age
Meanwhile, other interesting nuances emerge when we explore AI motivations by age.
For example, while “finding information” is the primary reason for using AI across all age groups in GWI’s survey, its relative importance varies by cohort.
Interestingly, older users are the most likely to cite this motivation, with nearly 4 in 5 active AI users over the age of 65 (78.5 percent) selecting this answer option.
Meanwhile, AI users aged 16 to 24 are more than 4 times more likely than users over the age of 65 to cite “learning or improving skills” as a primary AI motivation.
It’s also interesting to note that the relative ranking of “getting personalised recommendations” appears to increase with age.
Younger generations are more likely to choose this particular motivation, but they’re also more likely to cite a wider variety of other motivations ahead of this activity.
For example, just under 1 in 3 users aged 16 to 24 (32.3 percent) say that they use AI tools for personalised recommendations, ranking this activity seventh amongst the options available in GWI’s survey.
Meanwhile, just 21.8 percent of active AI users aged 65 and above say that they use these tools for personally tailored recommendations, but this is sufficient to rank this motivation third for this cohort.
I’m also intrigued by the consistently high ranking of “getting advice on problems”, which places second across all age groups except 16 to 24, where it ranks third.
AI as counsellor
And the relative importance of using AI for advice on problems is clearly evident in other datasets, too.
For example, the latest “AI in the Wild” research from Marc Zao-Sanders and Sara Biuk indicates that “therapy and companionship” remains people’s primary AI use case, echoing the findings from their previous round of research that we explored in last year’s report.
Moreover, in the duo’s analysis of this year’s findings, Zao-Sanders and Biuk report that this activity is still gaining momentum:
“We found more than 1,400 [therapy and companionship] entries this year, constituting 11 percent of our dataset – up from 5 percent last year – so it’s grown quickly in absolute and relative terms.”
It’s important to note that the work of Zao-Sanders and Biuk relies on a relatively novel analysis of content posted to social media, forums, and online communities such as YouTube, TikTok, Reddit, LinkedIn, and Quora.
For example, the source data may overindex for use cases that are inherently “conversation-worthy”, while simultaneously underindexing for activities that people are less comfortable discussing with others.
However, as long as we’re cognisant of the potential skews and biases within this dataset, I believe that these same factors are precisely what makes this research so interesting and valuable, not least because these elements can help us understand the role played by word of mouth in influencing people’s use of AI tools.
And furthermore, more “conventional” research echoes many of the duo’s findings too.
For example, we’ve already seen related trends in GWI’s research, while a separate Ipsos survey spanning 21 countries found that more than half of respondents (52 percent) expressed some degree of “excitement” about using AI for companionship.
This compares with 37 percent who said they weren’t excited, while 10 percent said they “didn’t know”.
Trends in online search
So how have trends in AI been affecting the world’s use of search engines?
Well, for initial context, it’s important to remember that search engines remain internet users’ top channel for both brand discovery and brand research.
Search’s relative share of influence has evolved over the past few years though, and data charting the use of these platforms over time reveals some important trends that merit careful exploration by marketers, publishers, and content creators.
Self-reported use of search engines
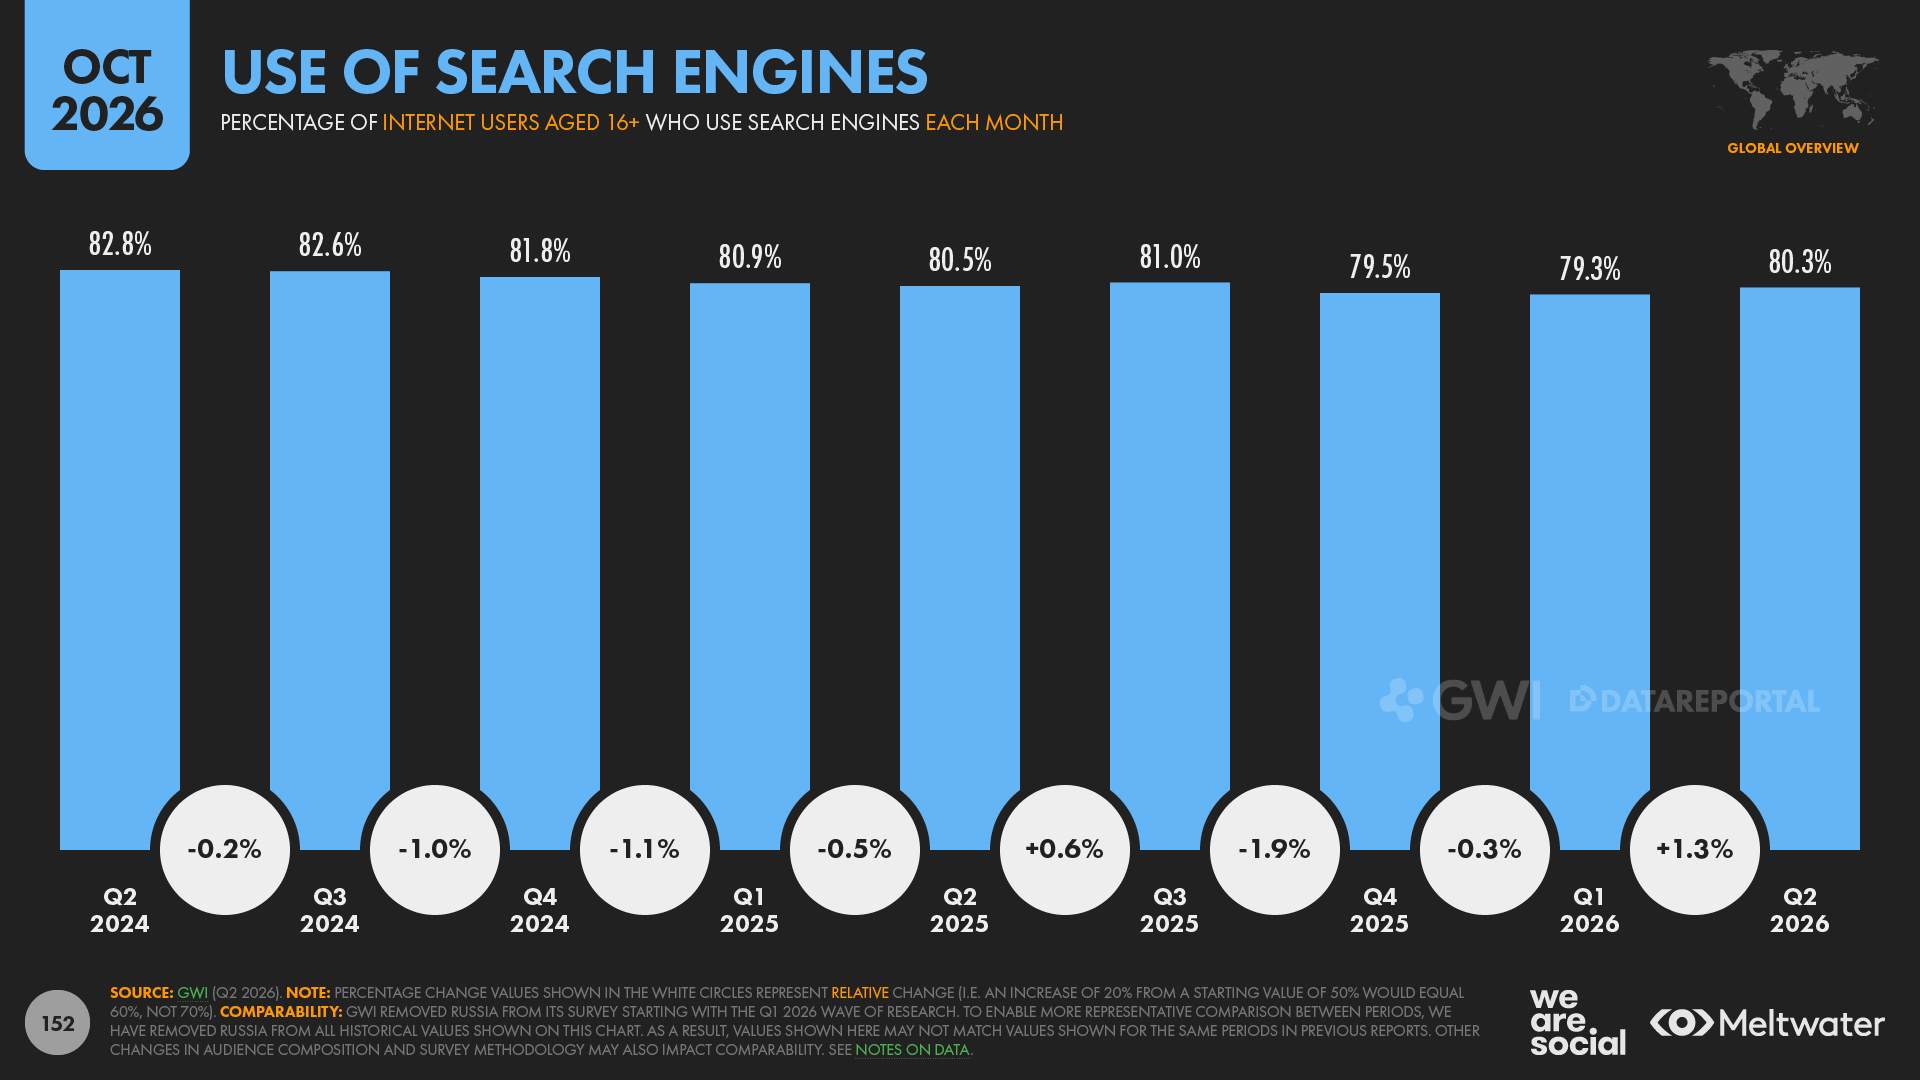
First up, GWI’s data indicates that the share of online adults who use search engines has been declining, albeit with fluctuations over time.
The company’s latest round of research reveals that 80.3 percent of worldwide internet users aged 16 and above used a search platform within the past month, with that figure down from 82.8 percent this time two years ago.
However, the current figure isn’t massively different from the figure we saw this time last year, with the Q2 2026 value reflecting a 0.2 percentage-point dip versus Q2 2025.
Search’s role in discovery
But while overall use of search engines appears to have declined, GWI’s data also shows that people are actually more likely to say that they discover brands via search engines today than they were in Q3 2022, just before ChatGPT launched to the public.
For perspective, in GWI’s research from that period, 30.5 percent of online adults said that they discovered brands, products, and services via search engines.
But in GWI’s most recent survey wave – Q2 2026 – the figure had climbed to 32.0 percent, with that 1.5 percentage point increase equating to a relative increase of almost 5 percent.
In absolute terms, that means more than 200 million more people discover brands via search engines today than did this time 4 years ago, although it’s important to note that overall growth in internet adoption has helped to augment that figure.
However, more recent data points to a gentle decline in the role that search engines play in brand discovery.
Indeed, the latest figure for the share of online adults who discover brands via search engines – 32.0 percent – is the lowest we’ve seen in GWI’s survey for almost three years.
Search’s role in brand research
Meanwhile, the decline in the role that search engines play in people’s brand research activities is even clearer.
Two years ago, in Q2 2024, 51.0 percent of only adults said that they used search engines to research brands and evaluate potential purchases, but in the latest figure for Q2 2026, that has fallen to just 45.3 percent.
On a relative basis, that 5.7 percentage-point decline equates to a relative difference of 11.2 percent in just two years, which is significant.
The rise of AI isn’t the only consideration here though, and – even before the arrival of ChatGPT – we’d seen a shift in people’s research behaviours away from search engines towards social media platforms.
Web traffic data
But a steady decline in the use of search engines is evident in Similarweb’s data too.
Across search engines that rank amongst Similarweb’s top 10,000 web domains, total monthly visits have declined by 4.3 percent over the past two years.
For perspective, Manochi’s analysis of this data indicates that search-oriented traffic to these domains has fallen by more than 3 billion monthly visits compared with the values we saw this time two years ago.
That’s obviously worrying for the search engines themselves, but it also has consequences for the third-party sites that depend on referral traffic from search engines.
However, it’s crucial to highlight that the rate of decline in traffic to search engines is lower than the average rate of decline we see across the web as a whole.
More specifically, Similarweb’s data indicates that total monthly visits across the world’s top 10,000 web domains have decreased by 6.8 percent over the past 24 months, whereas search-related traffic to search engine domains has declined by 4.3 percent.
In other words, declining visits to search engines may be the result of an overall decrease in web activity, and – while the net outcome of such declines is still important – this trend alone may not signify a specific decline in the role that search engines play in people’s lives.
On the other hand though, given that search engines often act as the gateway to other websites, there’s also an argument to be made that traffic across the web in general is declining precisely because people are using search engines less frequently.
Moreover, the rise of zero-click results potentially explains why traffic to search engines has been declining more slowly than traffic to non-search domains.
Conclusions: evolving search behaviours
So what should we make of all these trends?
Well, despite recent declines, search engines are still internet users’ primary source of brand discovery.
And while those declines are clearly something that all digital practitioners need to keep an eye on, current data do not suggest that search will lose its position at the top of the brand discovery rankings before the end of 2027.
Moreover, my analysis of the data for brand research channels suggests that search engines are likely to remain at the top of that particular ranking for the next 12 months too.
The longer-term balance is less clear though, and I suspect we may see a meaningful recalibration of each channel’s role by the end of this decade.
So, how you respond to these trends depends on your specific budget “horizon”, and you may need to adopt different strategies for near-term ad spend and longer-term marketing investments.
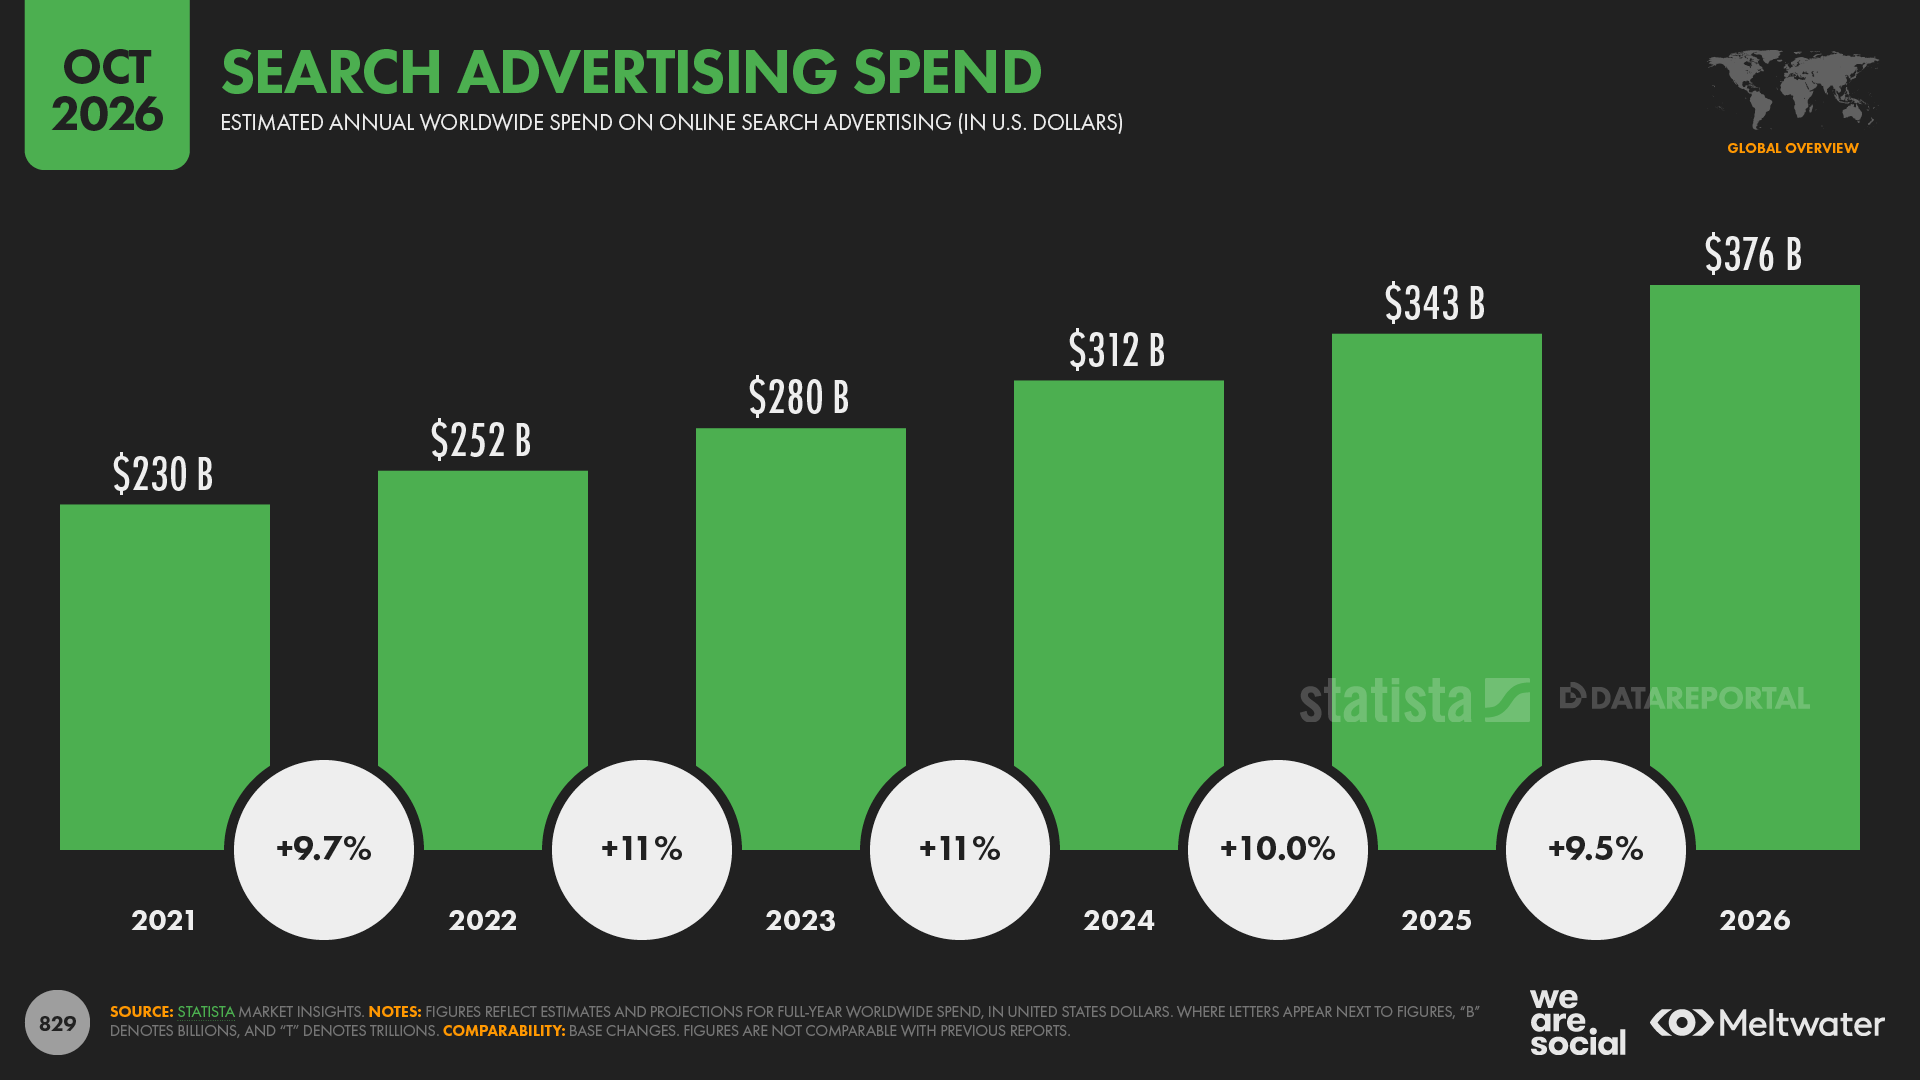
For context, Statista reports that online search will continue to capture the greatest share of digital ad spend in 2026, with the world’s marketers on track to spend US $376 billion on search ads this year.
The company’s forecasts predict that search will continue to claim the lions’ share of global ad spend in 2027 too, and from a marketing perspective – based on current data and trends – I think that’s still justified.
Yes, ads on TV, in social media, and on artificial intelligence platforms all offer exciting opportunities.
However, when we consider the relative immediacy of the role that search engines play in the purchase journey, it’s better to avoid getting distracted by potential developments when determining next quarter’s search advertising budget.
In my opinion, as long as search continues to top the channel rankings for brand discovery and brand research, there’s a compelling case to be made for search claiming the greatest share of overall ad spend.
However, this perspective only relates to ad spend; when it comes to thinking about how we build longer-term digital salience through activities like SEO and AEO, I think we may need to take a closer look at how we allocate budgets, and ensure they align with the direction of people’s evolving digital behaviours.
Having said that, every brand is different, and even the same brand will have different needs at different times and in different locations.
As a result, there are no silver bullets when it comes to building an optimised marketing plan, and you should be very wary of charlatans on social media offering exaggerated promises and generic recommendations, especially when it comes to new technologies.
Social media use continues to climb
But turning our attention to another influential channel in the buyer journey, Manochi’s analysis shows that social media use continues to climb, despite some “corrections” in source data.
For context, Meta appears to have “purged” a meaningful number of accounts across Facebook and Instagram over recent weeks, and this has resulted in tangible reductions in the reported reach figures for various countries.
And because we rely heavily on audience reach data from large platforms like Facebook, Instagram, YouTube, and TikTok to inform our social media user identities figures, these changes have resulted in somewhat subdued growth rates compared with previous years.
For reassurance, Meta appears to conduct these purges on a relatively regular basis, and we’ve covered similar trends in their audience data on a number of occasions in the past.
However, Meta did report a brief dip in its “family daily active people” metric as part of its Q1 2026 investor earnings report, which the company subsequently stated “was driven by internet disruptions in Iran (which were largely restored in the second quarter of 2026), as well as a restriction on access to WhatsApp in Russia.”
Despite these challenges though, data indicates that the number of monthly active social media user identities had increased to 5.81 billion by the start of October 2026, with this figure roughly 2.7 percent higher than the figure we reported this time last year.
That global user identities total puts the current global adoption rate tantalisingly close to the 70 percent mark, and barring any further purges in platform reach data, we should expect to pass that milestone some time in early 2027.
Meanwhile, GWI’s data reveals that social platforms remain the top online destination for the world’s internet users, with more than 97 percent of online adults saying that they’ve used either a social network or a messaging platform within the past month.
The current average of 97.1 percent is actually slightly lower than the figure we saw two years ago in Q2 2024, but GWI’s data indicates that use of social platforms has been increasing again over recent quarters.
GWI’s data also reveals that social platforms are consistently popular across geographies, with only one country – japan – seeing reported use rates of below 90 percent.
However, it’s interesting to note that the USA, the UK, and many countries across the EU fall below the global average, while developing economies tend to overindex on social media use.
Social time increases
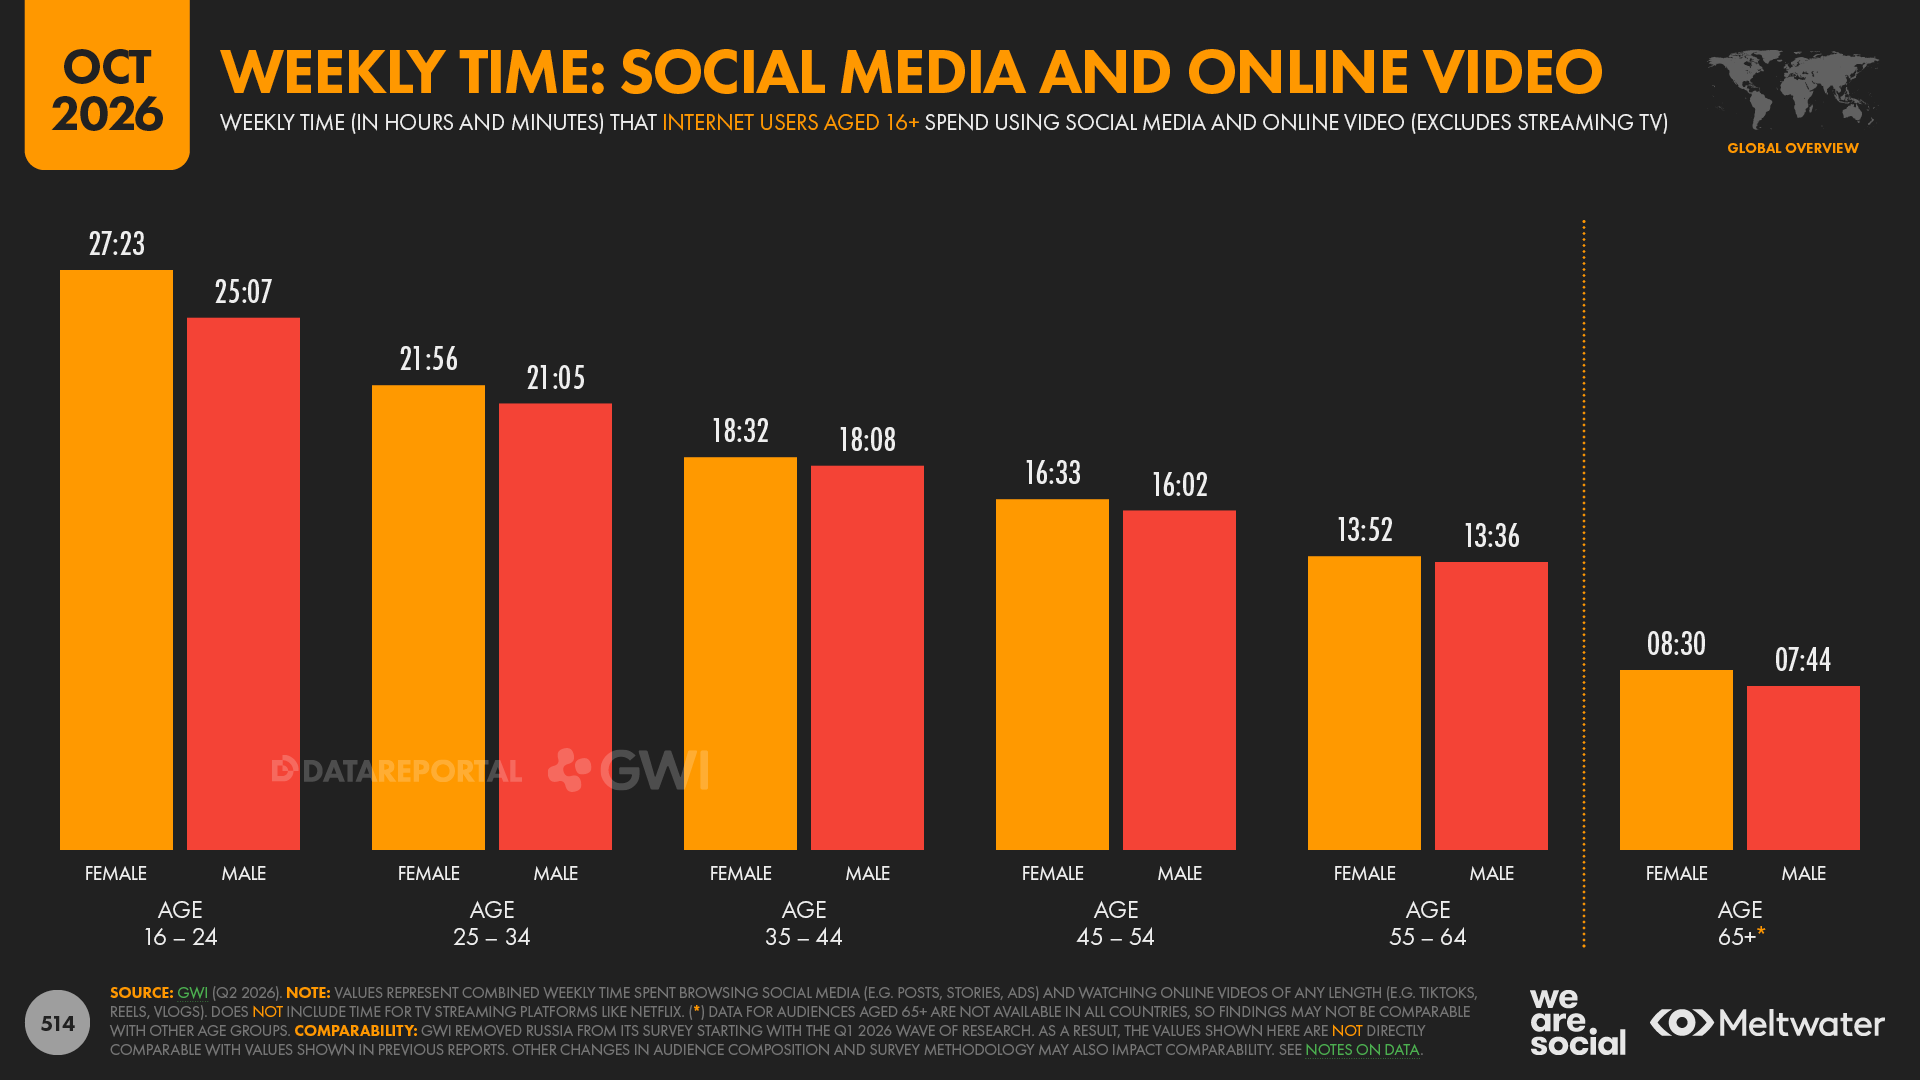
GWI’s data also shows that people are spending more time using social platforms.
The company recently revised the survey questions that explore time spent with media, so we’re unable to offer a complete timeline for this particular metric.
However, the available data reveal that the typical internet user has increased the time they spend using social media and online video platforms like YouTube and TikTok by 3.8 percent over the past year.
The company’s latest research indicates that people spend an average of 19 hours and 18 minutes per week using these platforms, which is 42 minutes more than the weekly average we saw this time last year.
Weekly averages are considerably higher in some countries though, with the typical Filipino spending more than 36 hours per week – roughly two full waking days – scrolling through social media and video feeds.
Meanwhile, social media time exceeds 24 hours per week in a total of 12 different countries.
As stereotypes suggest, younger people tend to spend more time on social media than older generations do.
For example, internet users between the ages of 16 and 24 spend an average of well over 24 hours per week scrolling social and video feeds, with that average more than three times higher than the equivalent figure for internet users aged 65 and above.
Today’s top social media channels
But which platforms are capturing the greatest share of the world’s social media activity?
Well, interestingly, the answer to that question varies meaningfully, depending on which metric we use.
Top social platform by time
Seeing as we explored time spent using social platforms in the previous section, let’s start by looking at total time spent.
For this particular metric, we’ll use Similarweb’s excellent App Intelligence data, which allows us to compare worldwide activity across various platforms’ Android and iOS mobile apps.
Note that we report this metric as an index, so the top platform will always have a reported value of 100, and also, for practical reasons, our analysis does not include data for China.
The data also only factors use within native mobile apps, and doesn’t include data for the time spent using each platform’s web interfaces.
That said, Manochi’s analysis indicates that YouTube captured the greatest share of total global social media time in August 2026, putting Google’s primary video platform at the top of this particular ranking.
WhatsApp isn’t far behind though, with Similarweb’s data indicating that the total time spent using the platform equated to 96.3 percent of the total we saw for YouTube.
And Instagram is only a hair behind its Meta sibling too, with data for August 2026 delivering an index value of 96.2.
TikTok ranks fourth with an index score of 79.8, while Facebook completes the top five, with an index of 61.9.
And interestingly, no other platform scores above 10, which offers clear evidence that the vast majority of social media time is concentrated across just a handful of platforms.
Average daily time per user
However, when we turn our attention to Similarweb’s data for average time per user, a different story emerges.
Once again, this data only includes activity within native mobile apps, and doesn’t factor web-based sessions.
Across each platform’s active users in August 2026, TikTok enjoys the highest average time per user, at an impressive 1 hour and 55 minutes per day.
Instagram ranks second, with the platform’s users averaging 1 hour and 40 minutes per day, while YouTube ranks third, at 1 hour and 28 minutes per day.
WhatsApp clocks in at an average of just over an hour per day, per user, while Facebook’s daily average slips just below the hour mark, at 59 minutes.
Monthly active users
And if you’re wondering why those two rankings look different, the answer lies in the total number of people who use each platform’s mobile app.
“Monthly active users” – or MAU – is one the most widely used metrics for assessing platform adoption, and these figures offer yet another alternative perspective on social media use.
As above though, it’s important to stress that these figures only factor activity within native mobile apps, and don’t include the use of these platforms on the web.
And as with total time spent, we report app MAU as an index, so the top platform always has a score of 100.
This quarter, that title goes to WhatsApp, with the app attracting the greatest number of monthly active users across its Android and iOS apps in August 2026.
This Similarweb data puts YouTube within touching distance though, with the Google video platform scoring an MAU index value of 96.2.
Facebook ranks third with 81.9, while Instagram sits just behind its stablemate on 77.9.
And TikTok rounds out the app MAU rankings for August 2026, with an index score of 72.0.
Self-reported platform use
But when we turn our attention to self-reported use of social platforms, yet another picture emerges.
For example, in GWI’s latest survey, Facebook comes out on top, with 58.1 percent of online adults saying that they used the “original” Meta platform at least once within the past month, regardless of whether that was via a mobile app or via a web-based interface.
Instagram ranks second in GWI’s data, with 56.6 percent of internet users aged 16 and above saying they used the platform within the past 30 days.
Meanwhile, YouTube places third in this particular dataset with 56.2 percent, and WhatsApp claims fourth place, with 54.9 percent.
Meta’s Messenger rounds out the top five, with 37.9 percent of online adults saying they used the Facebook messaging platform within the past month.
Favourite platforms
As if that wasn’t already enough, we’ve also got rankings based on average session time, average number of daily sessions, and each platform’s daily open rate, so be sure to check out our full Digital 2027 Global Overview Report to explore those datasets – you’ll find that in the embed towards the top of this page.
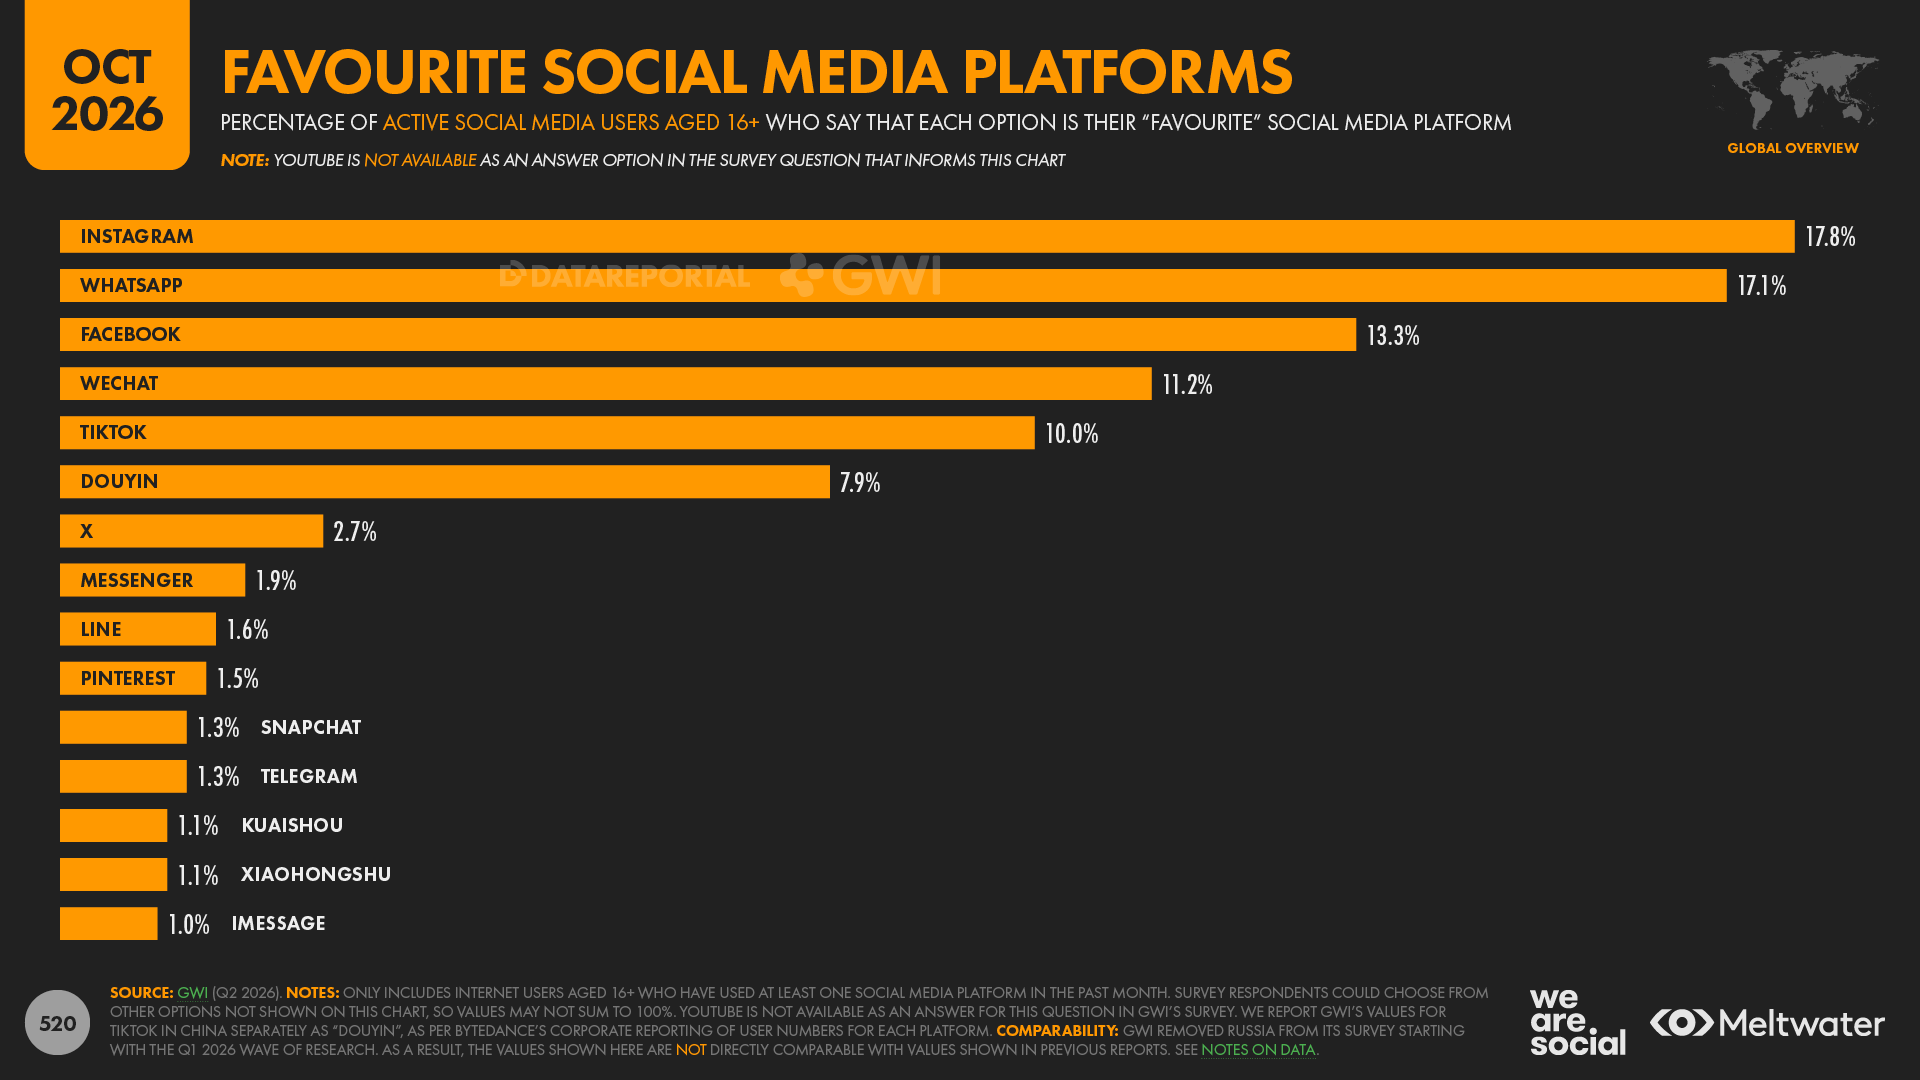
However, there’s one more dataset that I’d like to explore here, and from two different perspectives: people’s favourite social platforms.
Overall, Instagram claims the greatest share of votes across GWI’s global survey base, with 17.8 percent of active social media users aged 16 and above identifying this platform as their “favourite”.
WhatsApp ranks second, with 17.1 percent of the overall vote, while Facebook takes third place, with 13.3 percent.
Tencent’s WeChat ranks fourth with 11.2 percent of worldwide votes, although it’s important to stress that more than 99 percent of these votes come from internet users in mainland China.
And TikTok completes the top five, claiming 10.0 percent of worldwide votes amongst active social media users [note that we separate TikTok and Douyin in our reporting, as per Bytedance’s corporate reporting].
For added perspective, these five platforms account for more than 60 percent of total worldwide votes.
Meanwhile, trends in this data offer some particularly valuable insights when it comes to the directionality of preference, providing an indication of whether individual platforms are gaining or losing momentum.
And on that note, it’s worth highlighting that Instagram’s popularity continues to grow, despite already ranking top of this chart.
The share of active social media users identifying Instagram as their favourite social platform has increased from 16.7 this time last year, to 17.8 percent this year, with that 1.1 percentage-point increase equating to a relative year-on-year gain of 6.6 percent.
TikTok has gained similar momentum too, with the short video platform seeing its share of votes increase from 9.1 percent in Q2 2025, to 10.0 percent in Q2 2026.
For added perspective, that 0.9 percentage-point increase equates to a relative annual rise of 9.9 percent.
On the other hand, WhatsApp and Facebook have both seen their share of votes decrease, but the platform with the largest absolute decline in this dataset is WeChat, which has seen its share of the vote slip from 11.7 percent this time last year, to 11.2 percent in GWI’s latest data.
And for comparison, that 0.5 percentage-point dip equates to a relative decrease of 4.3 percent.
Social favourites: demographics
As you might expect, favourites vary by age and gender, but GWI’s data shows that these differences are not as marked as stereotypes might have you believe.
Crucially, to address a misrepresentation propagated by a certain trillionaire, younger men are actually more likely than younger women to identify Instagram as their favourite social platform [and on a related note, male users also make up more than half – 52.5 percent – of the ad audience reported by Instagram].
However, there’s a clear pattern of change across people’s preferences as they age, so marketers may want to pay particular attention to this chart, to understand how engagement with – and affinity for – different platforms vary by age group.
Active user favourites
Those findings are already interesting, but they tend to be skewed by the relative size of each platform’s user base, with larger platforms more likely to top the rankings.
So what happens when we focus on the share of active users of each platform who also identify that platform as their favourite?
You guessed it: once again, this perspective offers yet another valuable viewpoint.
Amongst worldwide users who have used the respective platform within the past 30 days, a hefty 43.8 percent of adult WeChat users say that Tencent’s super platform is their favourite.
Douyin ranks second, with mainland China’s equivalent of TikTok enjoying favourite status amongst 38.4 percent of its active user base aged 16 and above.
Instagram ranks third, with 30.5 percent of active users identifying the Meta platform as their number one choice, while stablemate WhatsApp follows close behind, with 30.2 percent of adult users identifying it as their favourite.
And TikTok completes the top five, with 26.9 percent of the platform’s active users selecting ByteDance’s global offering as their top pick.
Conclusions: social platforms
If you’re still wondering which platform comes out as the overall leader across these rankings, don’t worry; that’s deliberate.
These different perspectives are all intended to highlight that different social platforms offer different opportunities and benefits, depending on what you use them for, and what you’re hoping to achieve.
If you’re primarily focused on audience reach, the largest platforms will obviously deliver the largest opportunities, but data suggests that – outside of China – YouTube, WhatsApp, Facebook, Instagram, and TikTok all offer huge audiences.
However, it’s important to remember that the audiences of all these platforms see significant overlaps, so – if reach is your only goal – you can safely stick to just one or two of these platforms.
Inside of China, Weixin (i.e. WeChat) and Douyin are strong contenders too, but they’re by no means the only choices.
Meanwhile, if you’re looking for frequency, Similarweb’s data shows that messaging platforms like WhatsApp tend to enjoy the greatest number of daily sessions, and they also enjoy impressive daily open rates.
Alternatively, if you’re looking for depth of engagement, video platforms like YouTube, TikTok, and Instagram all deliver impressive figures for time spent.
But perhaps the most important takeaway from all this valuable data is that our audiences continue to use a wide variety of different social platforms every month.
So, instead of getting hung up on user numbers or media headlines, my recommendation would be to set some clear objectives for each of your social media activities, and then identify the one or two platforms that deliver the most efficient and effective opportunities to achieve your desired outcomes.
Crucially though, avoid the urge to try and be active on all social platforms, because you’ll quickly hit decreasing marginal returns once you go beyond three or four.
But having said that, don’t be afraid to go with smaller platforms if they offer more cost effective opportunities to reach the audiences that you care about.
The return of voice?
Turning our attention to the future, a recent article in the FT asserts that voice is a key focus for AI development, and that for the companies building these tools, “the keyboard increasingly looks like a temporary interface rather than the destination.”
“Voice is becoming one of the most natural ways for people to use software. It lets someone ask for help while driving, change a travel plan while walking through an airport, get support in their preferred language, or move through a task without stopping to type.”
In other words, after something of a brief hiatus, it seems Big Tech may be falling back in love with voice.
But what about people on the street?
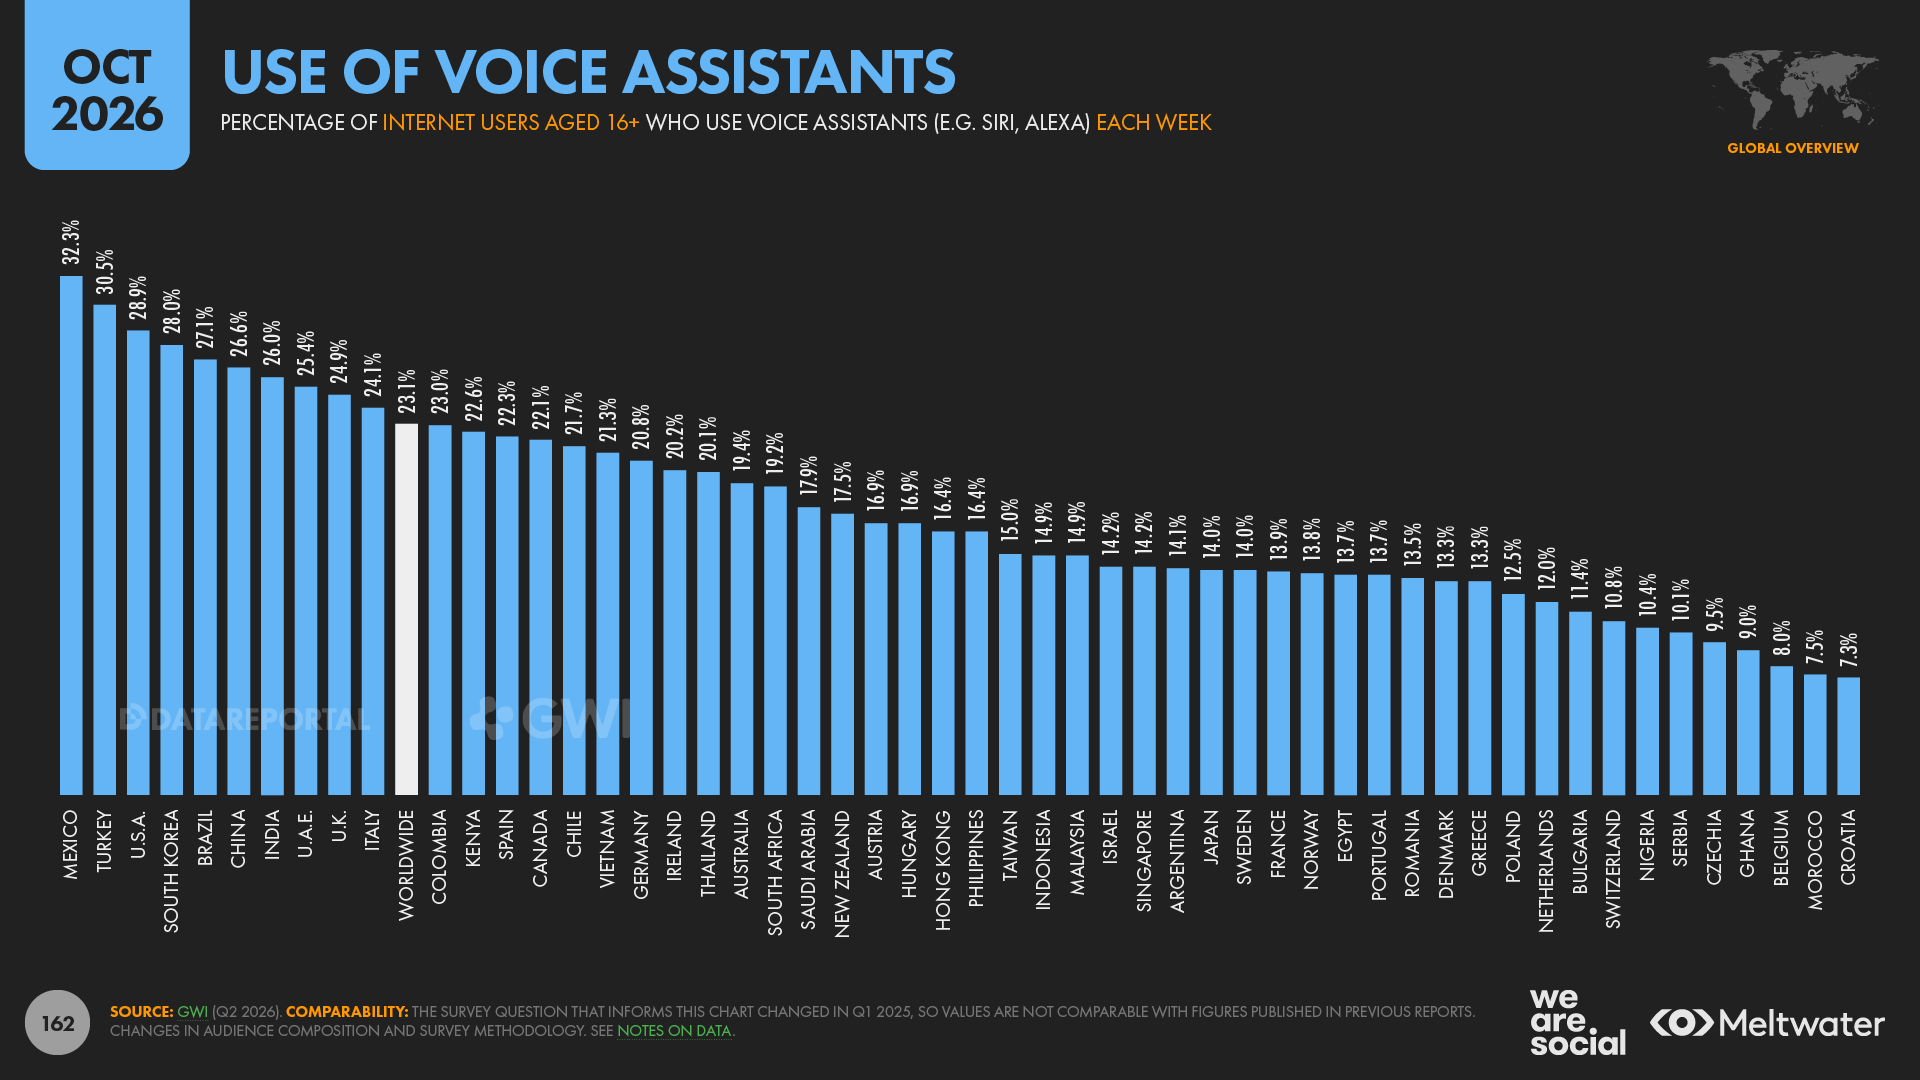
GWI recently changed the question in their survey that tracks the use of voice interfaces, so we’re unable to offer a fully representative timeline for the evolving use of these technologies.
The available data does point to modest growth in the share of online adults who say that they use these tools each week, but they’re still a long way from achieving ubiquity.
Indeed, at a worldwide level, less than a quarter – 23.1 percent – of survey respondents say that they used a voice assistant like Siri or Alexa to find information or complete an action (e.g. playing a song) within the past seven days.
Usage rates vary considerably by geography too, from a high of 32.2 percent in Mexico, to just 7.3 percent in Croatia.
It’s also worth highlighting that China and India help to boost that global average, and regular use remains below 20 percent across much of Europe and South-East Asia.
Interestingly, age and gender appear to play a role in determining the likelihood that someone will use voice assistants, with younger men the most likely to say that they’ve used one of these interfaces within the past week.
So, while developers may have found renewed enthusiasm for voice control, it seems they still have some work to do to convince the masses to move from typing to talking.
The resurgence of email
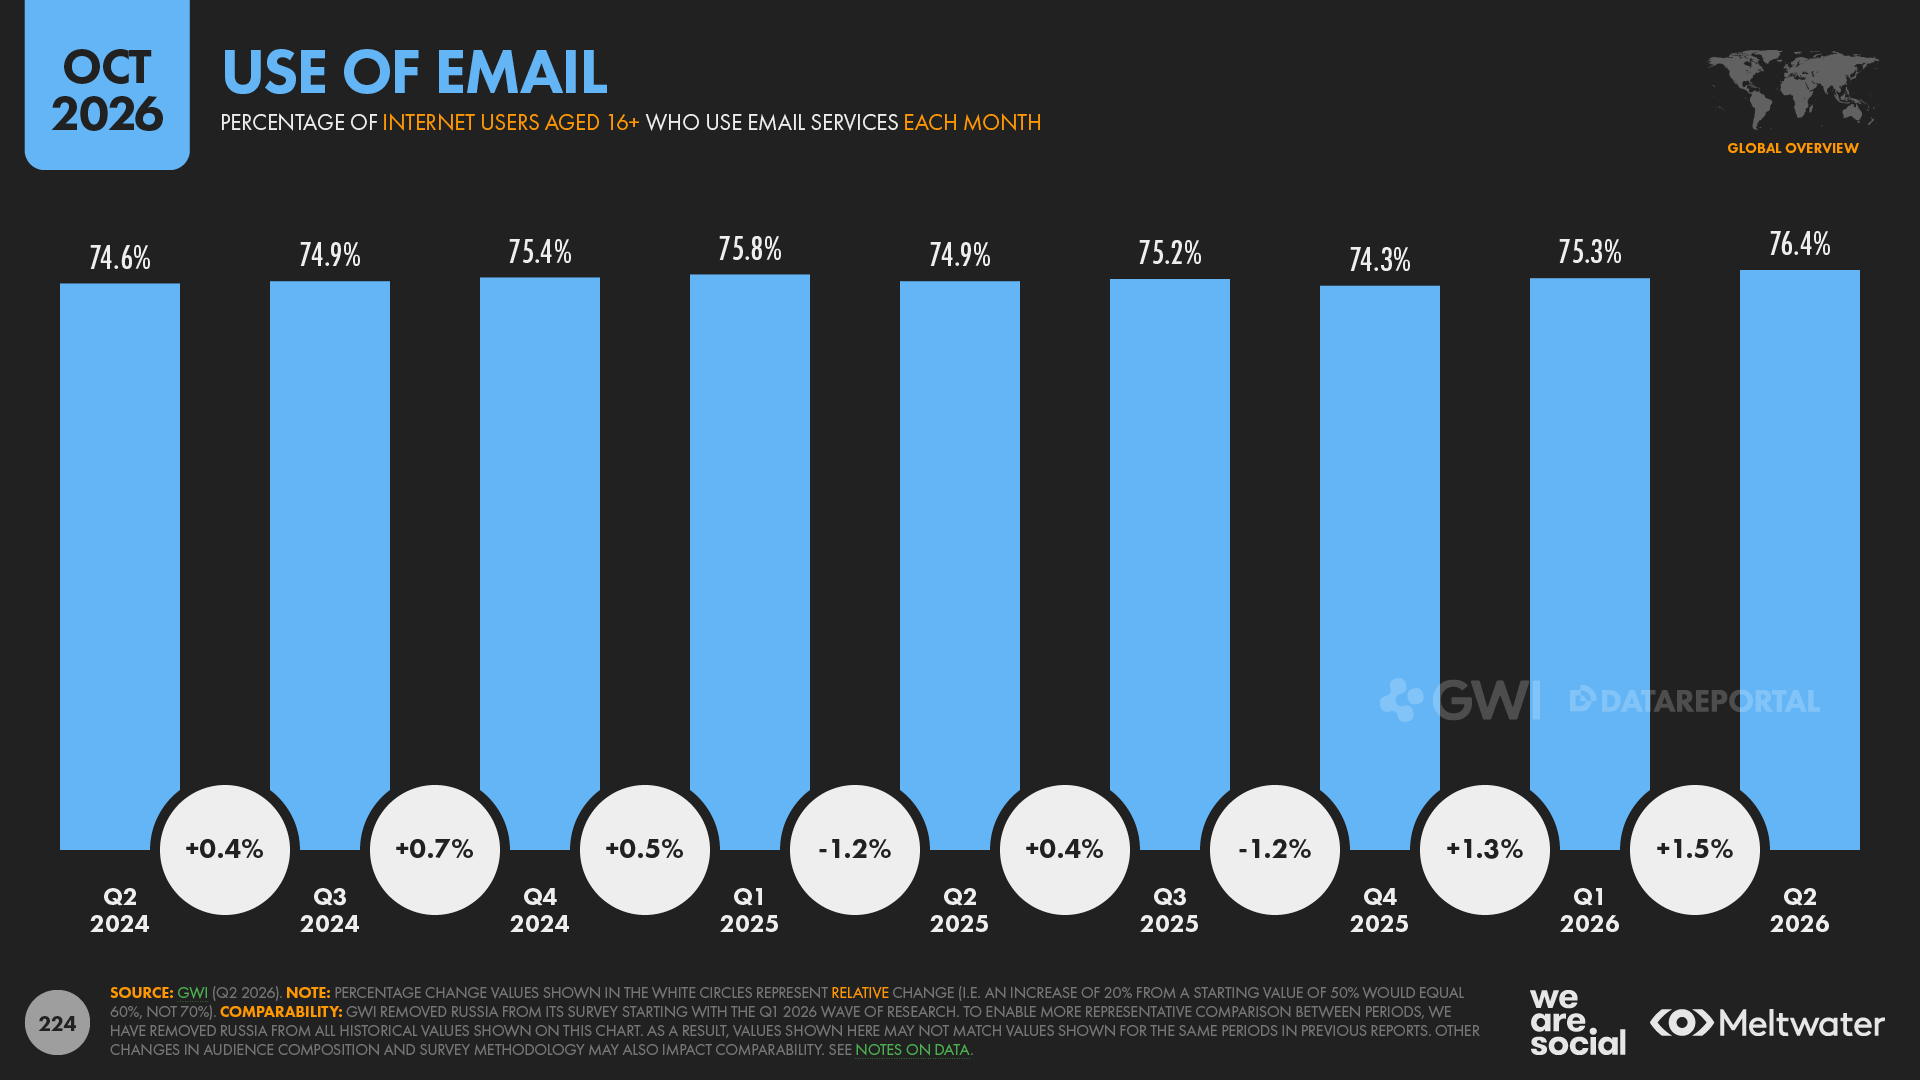
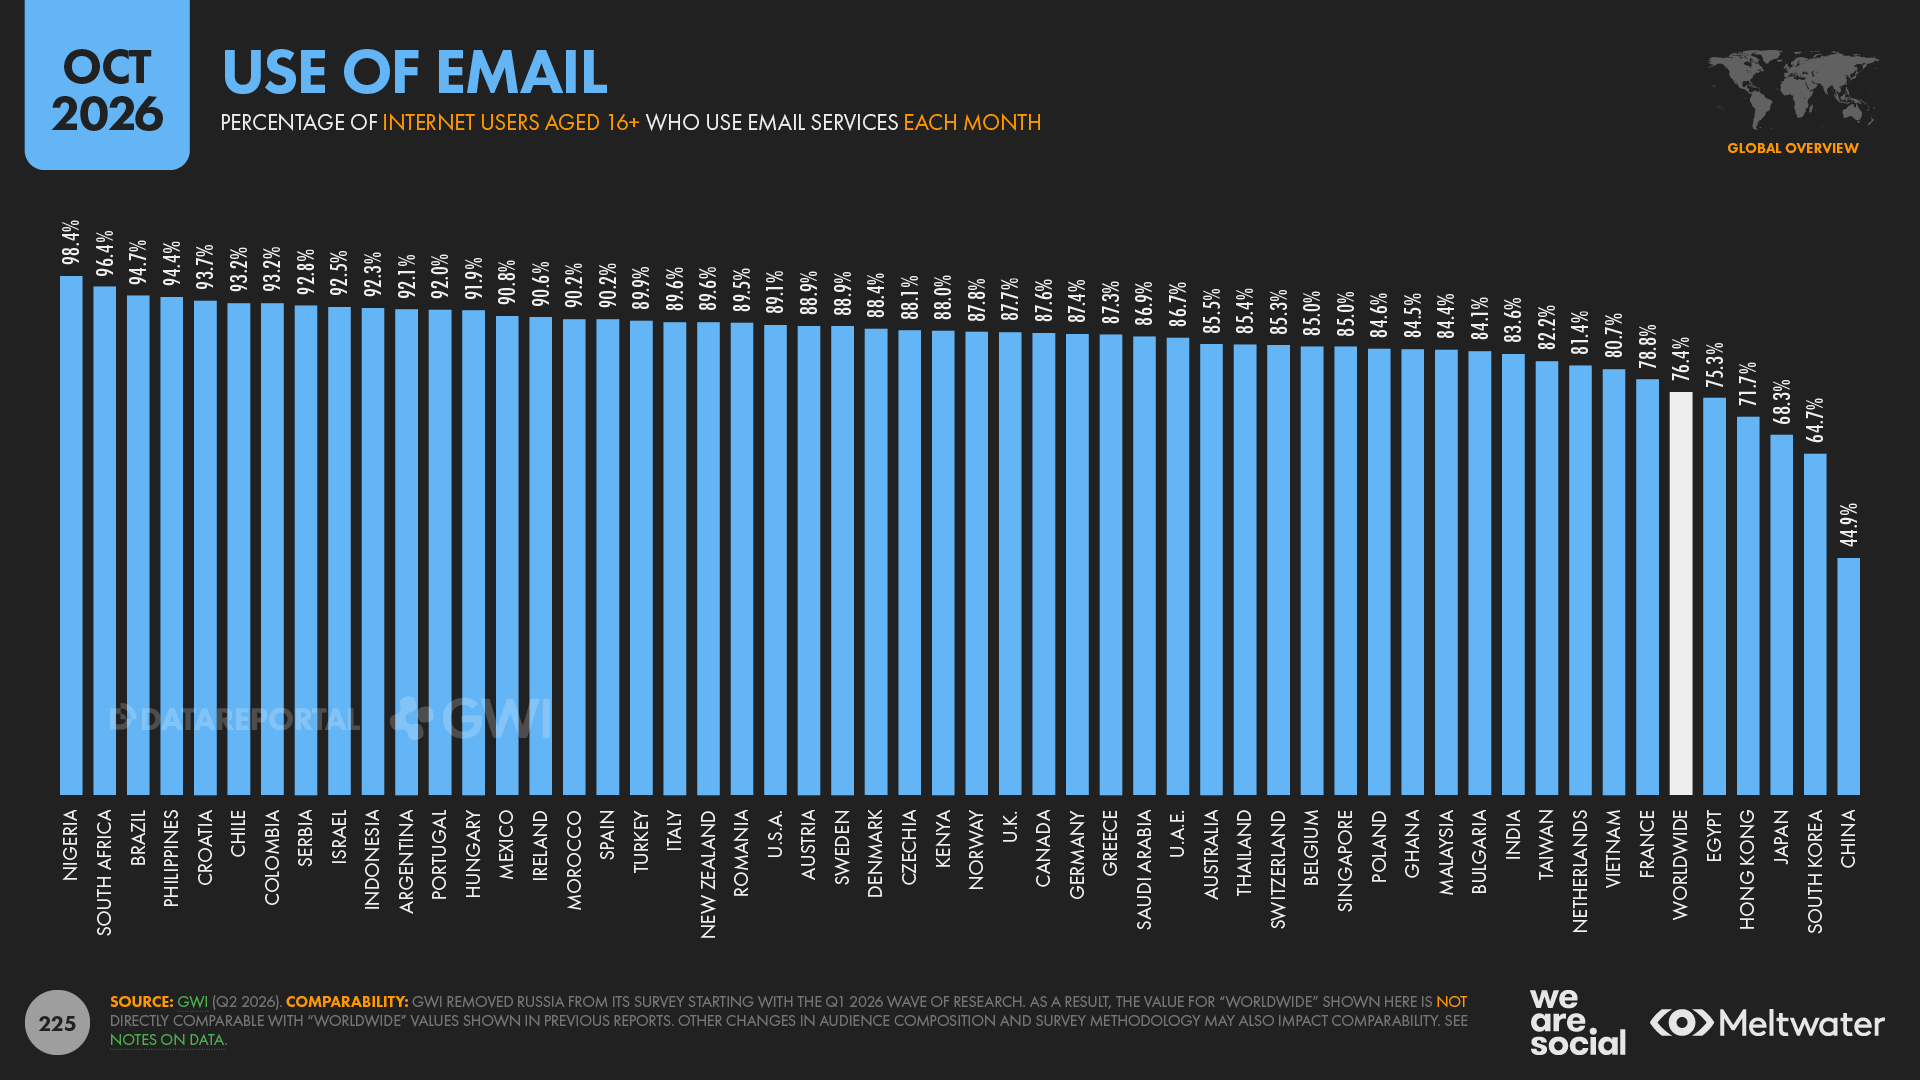
And lastly, in something of a blast from the past, the latest data from GWI shows that monthly use of email now sits at the highest level we’ve seen for this dataset, demonstrating the impressive resilience of this stalwart of online communication.
More than three quarters of online adults say that they’ve used email within the past 30 days, with 76.4 percent of respondents to GWI’s survey answering in the affirmative in the company’s Q2 2026 wave of research.
But despite these already impressive figures, values for China have actually significantly diluted this global average, and if we remove China from the dataset, that worldwide average jumps to 86.6 percent.
And intriguingly, despite markedly different digital landscapes across the region, email sees consistently lower use across all East-Asian countries in GWI’s survey, with South Korea, Japan, and Hong Kong all falling well below the global average.
Meanwhile, at the other end of the scale, Nigerians are the most likely to say they use email, with an impressive 98.4 percent of respondents in the country saying they’ve used an email service at least once within the past month.
South Africa also sees monthly email usage in excess of 95 percent, while Brazil takes third place, with 94.7 percent.
Data confounds stereotypes
GWI finds that retirees are the most likely to use email, but the survey’s youngest cohort – internet users aged 16 to 24 – takes second place in the age rankings, with 78.9 percent of this age group saying that they use email at least once per month.
And in a further contradiction to stereotypes, GWI’s data indicates that email use actually declines with age, with the exception of those retirees [however, note that GWI’s survey only includes this older age group in a selection of countries, so there’s a good chance that this trend would continue if this older demographic was included across all geographies].
Beyond satisfying trivia, these trends offer valuable findings for marketers.
Indeed, with the decline in web use that we’ve covered extensively in this article, together with the rising influence of “black box” algorithms in AI and social platforms, email remains one of the few channels over which marketers retain some element of control.
So, if you’re not currently using email within your marketing mix, it might be worth (re)exploring its potential in 2027.
Digging deeper
That’s (almost) all for this year’s summary [does 10,000 words still qualify as a summary?!], but if you’d like to explore even more detailed analyses of this year’s Global Digital dataset, here’s a selection of additional Digital 2027 content:
Over the next few weeks, we’ll also be publishing a complete collection of Digital 2027 local country reports over on DataReportal.
These reports will contain an exceptional wealth of data profiling digital adoption and behaviour across all except three of the world’s inhabited countries [sadly, there’s simply not enough data to profile North Korea, Pitcairn, or the Vatican].
These reports will be available as soon as they’re ready, starting from mid-November 2026; the best place to find what you’re looking for is our DataReportal Library index page.
Meanwhile, if you’d like to stay up to date with my updates on LinkedIn, please feel free to connect with me there.
And lastly, look out for some exciting new formats for this Global Digital Report series, coming to your screens from early 2027…
And finally…
But just before we wrap up, let’s take a look at purrhaps the most impawtant chart in this year’s report.
And in a tail that’s becoming eerily furmiliar, it’s been another ruff year for canines.
Furst up, Google’s data suggests that cats continue to rule the web at the end of 2026, with the search giant fetching 4.15 billion results about cats, compared with just 4.02 billion for dogs.
Our suspicion is that this may come down to inadequate API training though, and the pack may need to be reminded not to bark at the Postman.
We’ve also received anonymous alligators allegations that cats have been colluding with a python to manipulate these results, but we haven’t found any conclawsive evidence… yet.
But either way, content creators have clearly gone barking mad, because Google Trends data demonstrates that searches for dogs still outnumber searches for cats by a ratio of 86 to 53.
Having said that, data suggests that cats are also more pawpular on Wikipedia, where views of pages about cats attracted 3.17 million views over the past year, compared with just 2.19 million views for pages about dogs.
On the other hand paw, the #dogsofinstagram have been hard at work over recent months, with Instagram posts tagged with #dog outnumbering posts tagged with #cat by 398 million to 313 million.
Dogs have given up the lead on TikTok though, with views of posts tagged with #cat now outnumbering views of posts tagged with #dog by some 90 billion.
Meanwhile, there’s almost no contest on Reddit, where humans on r/cats outnumber humans on r/dogs by a factor of almost 5 to 1.
And in something of a shock reversal of furtunes, X reports that its ad audience is now significantly more likely to be interested in cats than in dogs.
Given the figures we saw for that X dataset last year, I have a feline something’s afootapaw there.
But despite lingering doubts about purrtential fowl play, in light of the appawrent evidence, we’re going to need to call 2026 for the felines… again.
However, we’ve heard mutterings that dogs have been busy in the lab developing a pawerful new LLM: Clawd.ai.
And if their furtive efforts can push the frontier faster than CatGPT, perhaps 2027 will #BeMoreDog.
Disclosure: Simon Kemp is a brand ambassador for GWI.

 Reports