Digital 2019: Australia social media usage is growing
Reports
michele.danno
Every year We Are Social teams up with Hootsuite to create a comprehensive global report that sheds light on the digital and social landscape during the past 12 months. For the 2019 report we analysed 100,000 points of data, compiled into over 7,000 charts, covering over 230 countries – including Australia, of course. Collecting and analysing this data year-on-year means we can see changes in online populations, internet use, social media behaviours and platform fluctuations.
There’s a lot of data to sift through, so to ease you in we’ve broken down some of the most interesting stories to come out of the Australian data. For all the data geeks who want the full picture, the full Global and Australian reports are linked to here and at the end of this article.
So what do we know?
The bigger picture
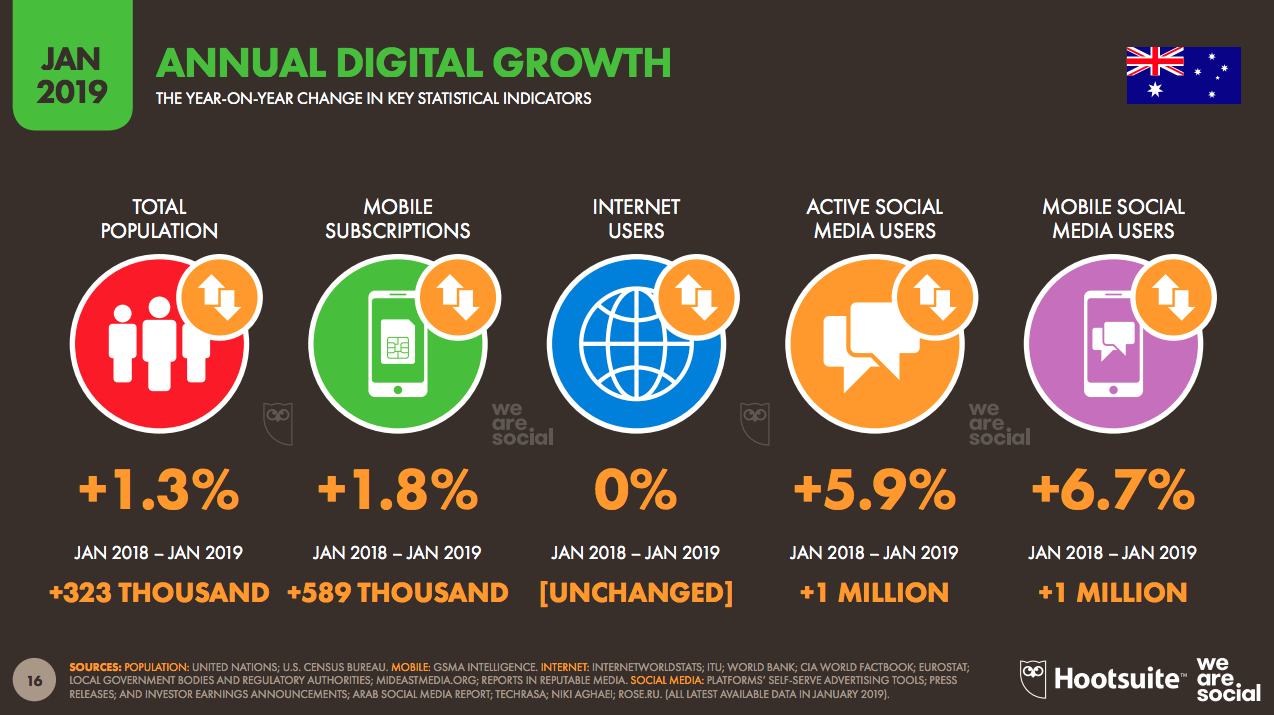
The bigger picture tells us that despite incremental growth from 2015 to 2017, the number of internet users in Australia between 2018 and 2019 remained unchanged. However, the number of active social media users has continued to increase by +5.9% and the number of mobile social media users has increased by +6.7%.
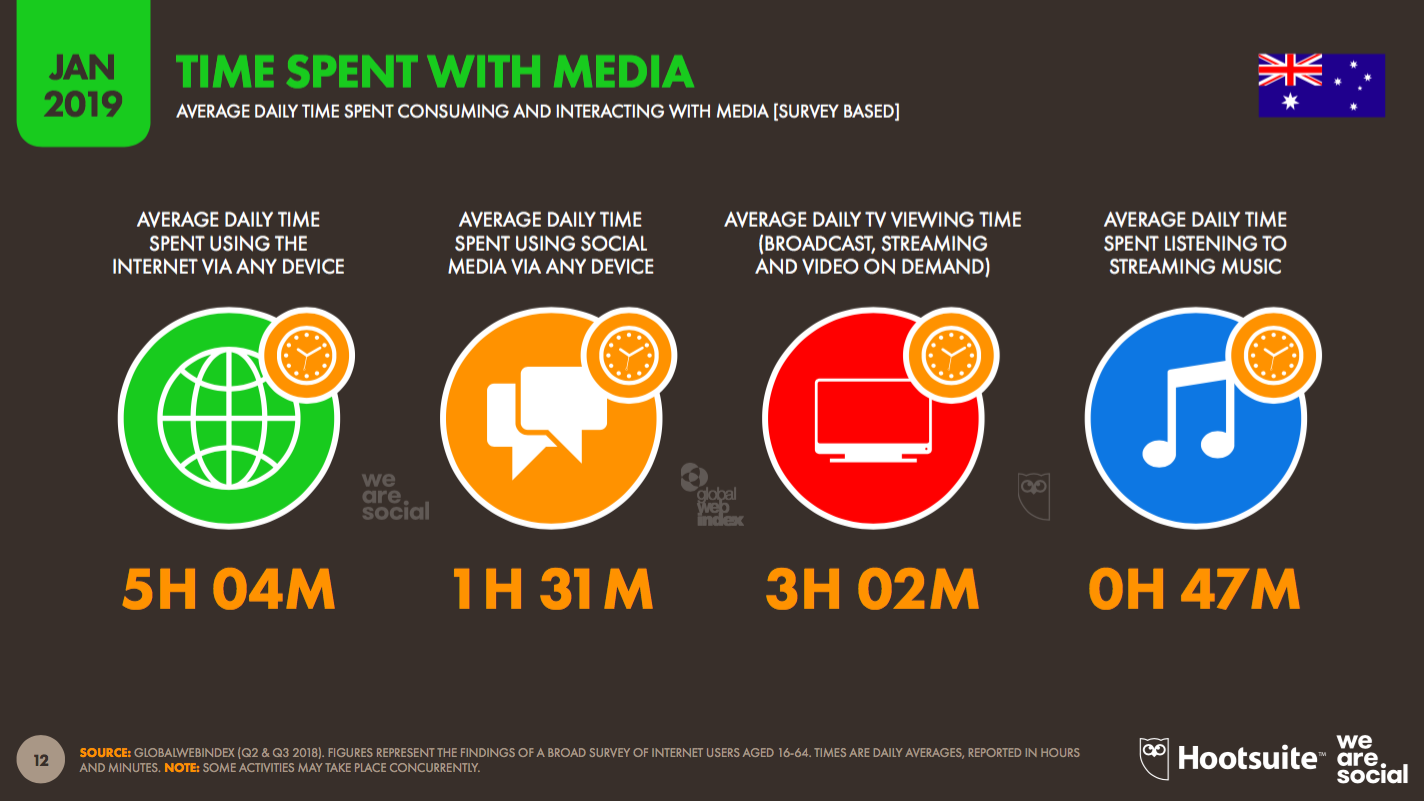
Until 2018, time online had been on an upward projection but in the past year the average time Aussies spend on the internet every day decreased by a whole 30 minutes; from 5 hours 34 minutes to 5 hour 4 minutes. Half an hour might not sound like a lot, but extrapolated over a month it equates to 15 hours less time spent on the internet. In contrast, the average daily time spent on social media has only decreased by 8 minutes year-on-year.
How has platform use changed?
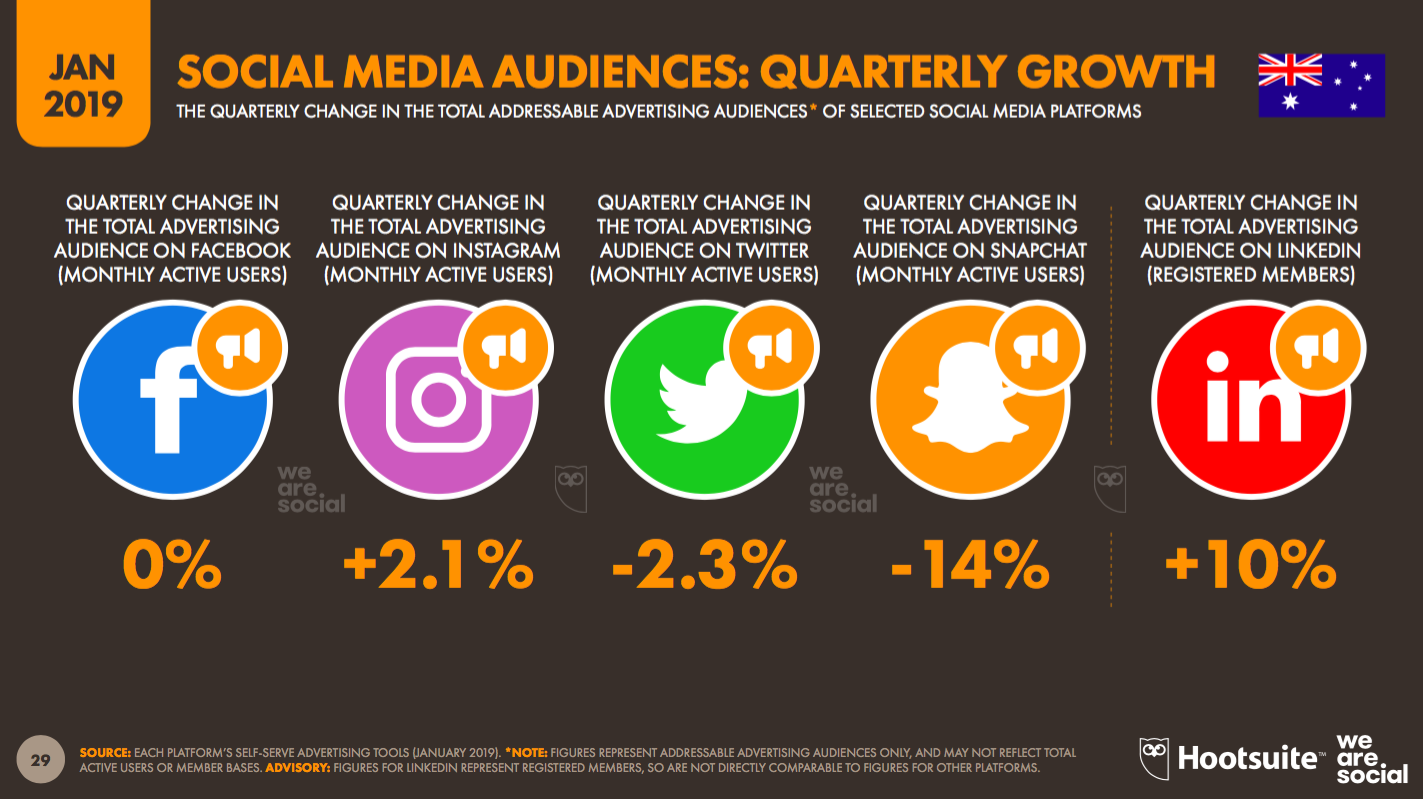
There were no surprises to see that Facebook still tops the social media platforms with 16 million users. Instagram has continued a steady growth of +2.1% and LinkedIn has seen a recent growth spurt, up +10% in quarter-on-quarter growth of advertising reach. The two losers during the past quarter have been Twitter and Snapchat; down respectively -2.3% and a whopping -14% in quarter-on-quarter growth in advertising reach respectively.
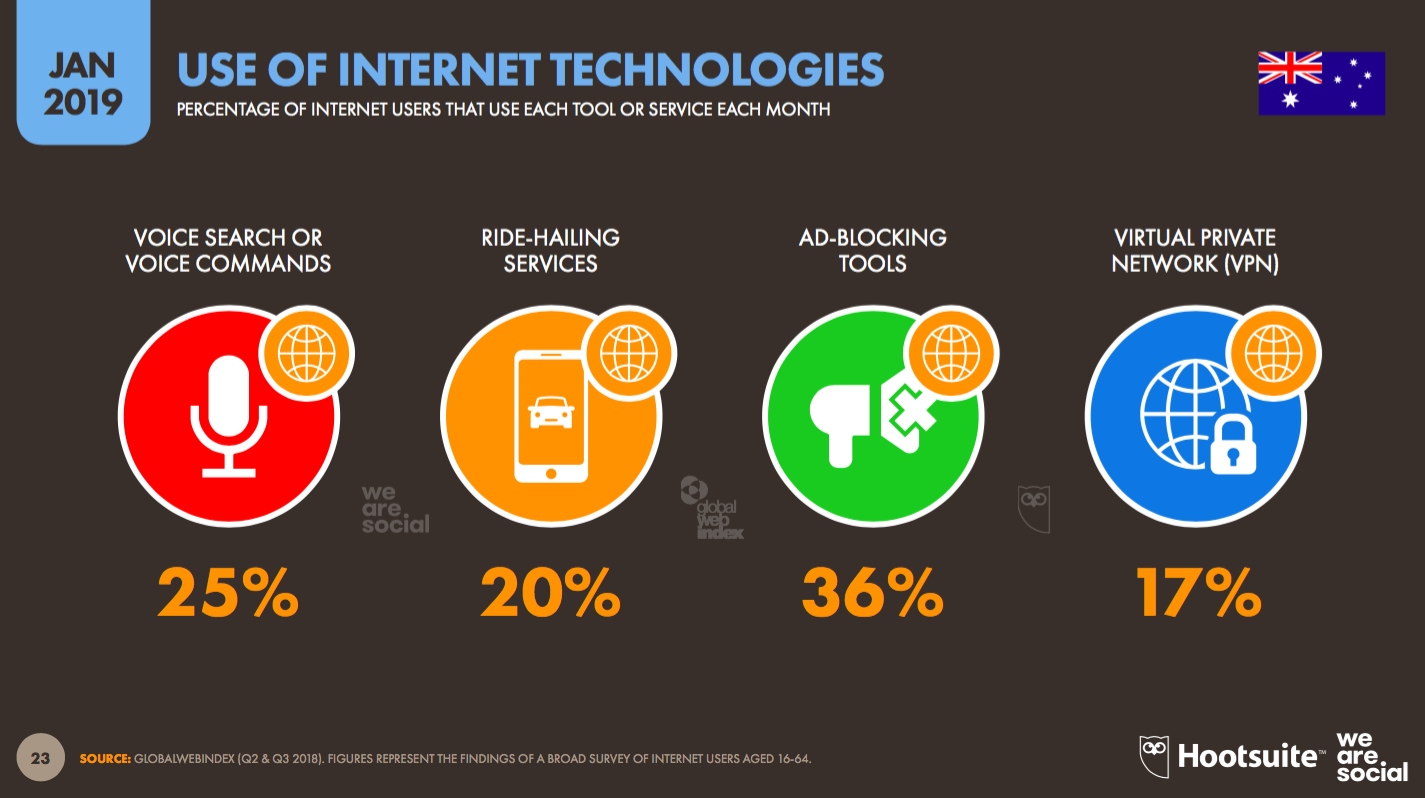
New tech has influenced behaviour
What can we discern about user behaviour? For the first time we have reported on the use of internet technologies. We’ve seen 25% of internet users are using voice search or voice commands. All of the evidence suggests this is only going to increase year-on-year and is set to disrupt the search landscape as people will no longer be seeing a page of search results, but hearing one or two results cherry-picked by their voice assistant. Also of note is over one-third of the Australian internet population are using ad blocking tools. This aversion to advertising is also reflected in the increasing number of subscriptions to online streaming services such as Netflix, that offer ad free entertainment.
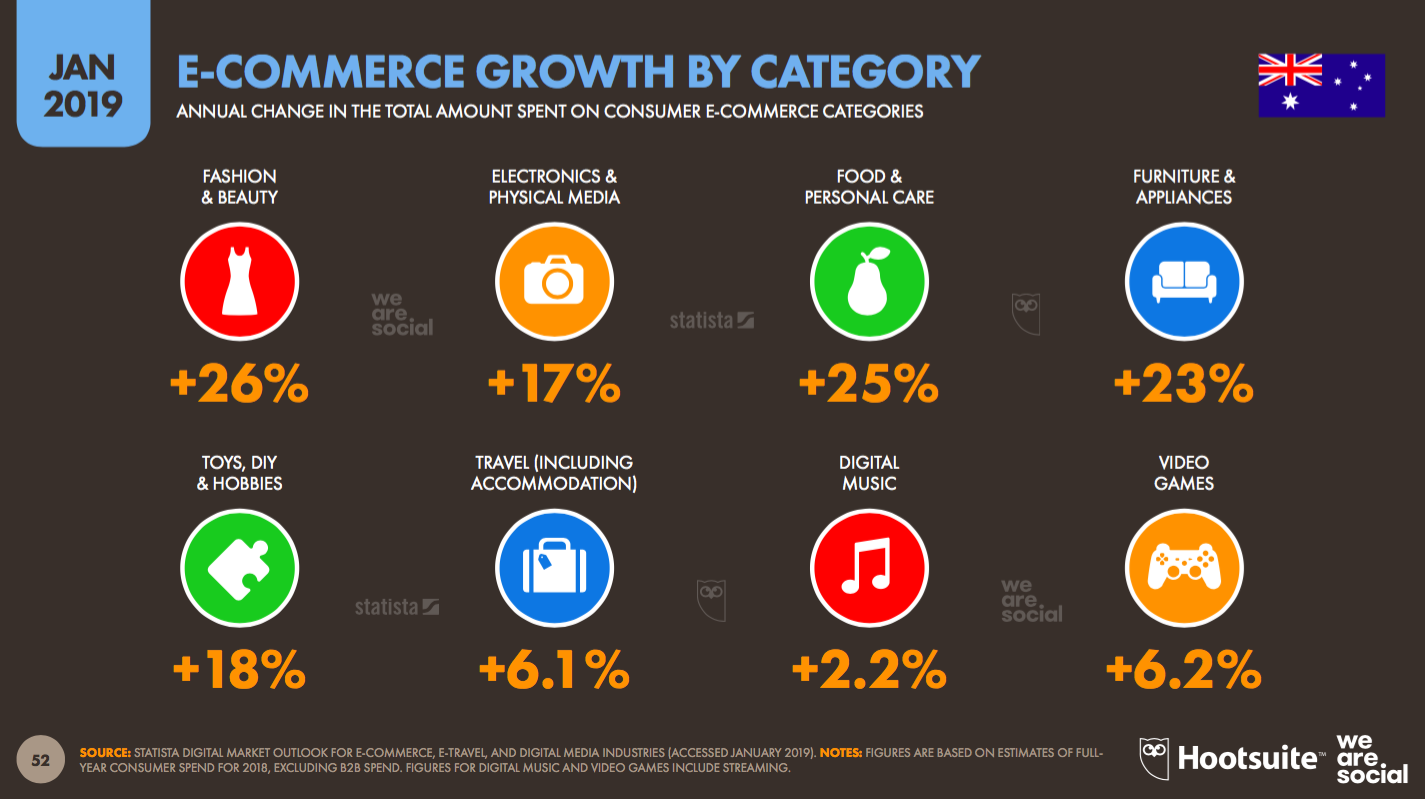
Online shopping experiences a marked growth
Online shopping has seen a big growth in 2018. All metrics are up across the board: people searching for products & services (+11%), people visiting online stores (+11%), people purchasing online (+10%) via both desktop (+22%) and mobile (+11%). A number of categories have seen big increases in spend online as a result. Overall the total value of the consumer goods e-commerce market has increased +22% year-on-year to now be worth US$18.63 billion.
These stats clearly show any stigma or concerns around shopping online are in rapid decline. Australians are prepared to spend online across desktop, mobile and increasingly, social. If ever there was a time to seriously think about social shopping for your brand, 2019 is it.
We’ve barely skimmed the surface here in terms of the highlight stats and interesting stories within the Digital 2019 Australia report. You can dig into the full Australia specific data below, or read our Global Digital Analysishere.
And if you have any question, get in touch for a chat.
 Reports