The world has changed dramatically over the first three months of 2020, with the COVID-19 pandemic impacting almost every aspect of our lives. These changes have been clearly evident in the world’s digital behaviours too, especially as billions of people turn to connected devices to help them cope with life and work under lockdown.
We’ve dedicated a significant portion of our Digital 2020 April Global Statshot Report to exploring these extraordinary trends, but this update also includes all of the usual data points that we cover in our ongoing series of Global Digital Reports too, including detailed analysis of how people around the world are using the internet, social media, mobile devices, and ecommerce.
Key headlines in this quarter’s report include:
Big jumps in digital activity, especially in countries that have seen the strictest lockdowns;
Significant increases in social media use, with video calling taking centre stage;
Accelerating adoption of ecommerce, particularly for grocery shopping;
An increase in the amount of time spent playing video games and watching esports;
Some unexpected opportunities for digital advertisers.
You’ll find my comprehensive analysis of all these stories and more in the article below, but be warned: at roughly 7,000 words, it’s a bit of a monster, so you may want to grab a coffee and get comfortable before digging in.
Just before we begin, our teams at We Are Social, Hootsuite and Kepios would like to extend a very special thank you to all of the partners who made this report possible, especially under the challenging circumstances. In particular, we’d like to thank the team at GlobalWebIndex for being so generous with the data from their ongoing – and exceptionally insightful – Coronavirus Multi-Market Study.
OK, sitting comfortably? Then let’s dive in…
Stats for starters You’ll find all of the charts in our April Statshot Report in the SlideShare embed below (click here if that’s not working for you), but keep reading after the embed, because the rest of this article will help you to make sense of what all these numbers mean.
Key headlines: global digital adoption still growing The latest data show that the number of internet users and social media users around the world have both increased by more than 300 million over the past twelve months, despite delays in reporting in some key countries due to the coronavirus outbreak.
DataReportal analysis indicates that 4.57 billion people now use the internet, an increase of more than 7 percent since this time last year. Social media users are growing even faster, up by more than 8 percent since April 2019 to reach 3.81 billion today.
Global social media use hasn’t quite reached the 50 percent penetration mark yet, but the latest trends suggest that we should pass this key milestone before the end of 2020.
The number of people using mobile phones has also increased, with global user numbers up by 128 million over the past twelve months. GSMA Intelligence reported 5.16 billion unique mobile users at the start of April 2020, meaning that roughly two-thirds of the world’s total population uses a mobile phone today.
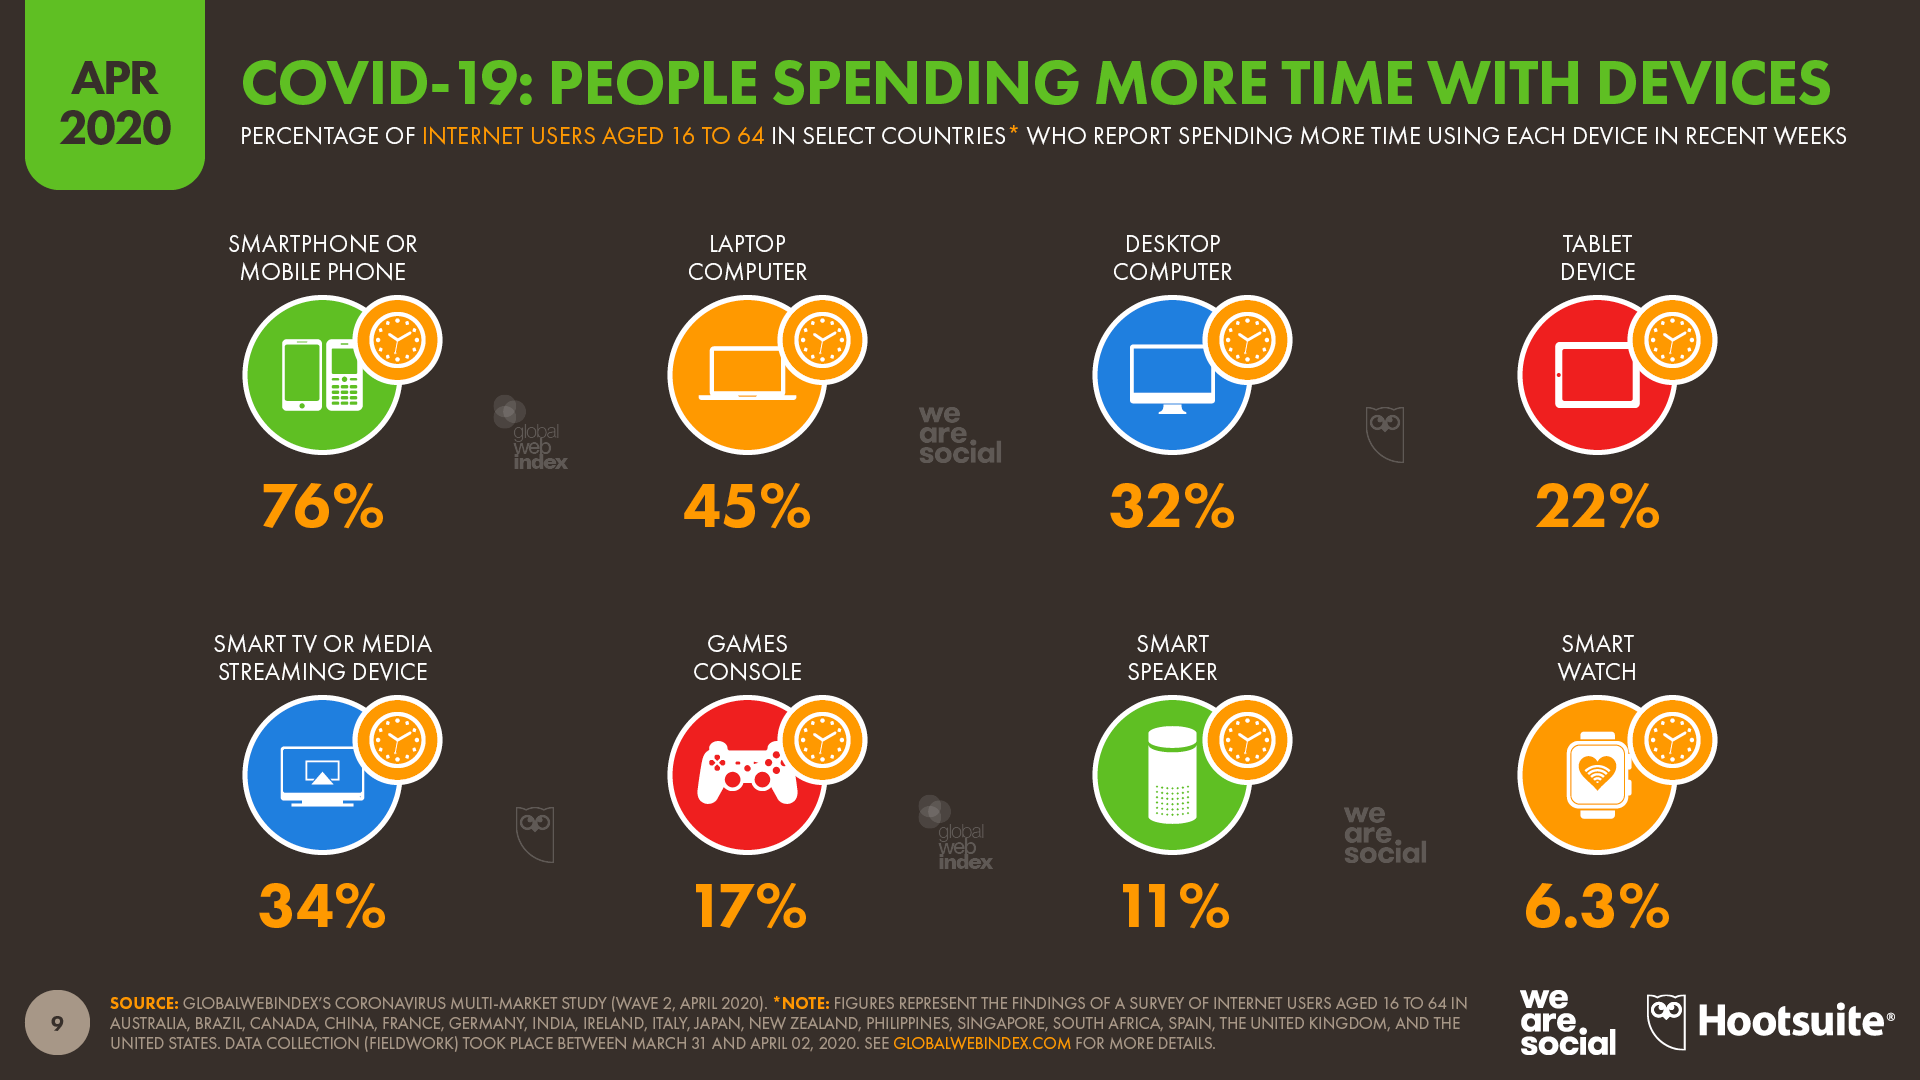
Use of connected devices jumps Detailed research from GlobalWebIndex reveals that people all over the world have been spending considerably more time on their digital devices as a result of coronavirus lockdowns.
More than three-quarters (76 percent) of internet users aged between 16 and 64 in surveyed countries say they’ve been spending more time using their smartphones in recent weeks compared to their pre-lockdown behaviours, with almost 4 in 5 women reporting an increase in mobile use.
Perhaps unsurprisingly, people report that they’ve been spending longer watching television too, with more than a third (34 percent) of internet users across the 17 countries in GlobalWebIndex’s special coronavirus study saying that they’ve been spending more time using smart TVs and dedicated streaming devices such as Apple TV and Amazon’s Fire Stick.
Other data supports this finding too, with American network AT&T reporting that Netflix traffic has reached all-time highs during the US coronavirus lockdown.
More people have been signing up for streaming services too, with Disney Plus in particular posting impressive growth during the first three months of 2020. The platform’s recent launch in Europe and India has helped to boost subscribers to more than 50 million in just five months since its launch, while the platform has almost doubled its subscriber base since the start of 2020.
Netflix has also seen its user base grow since the start of the year. The company announced that it attracted 16 million new paying subscribers to its service in the first three months of 2020, equating to quarter-on-quarter growth of 9 percent.
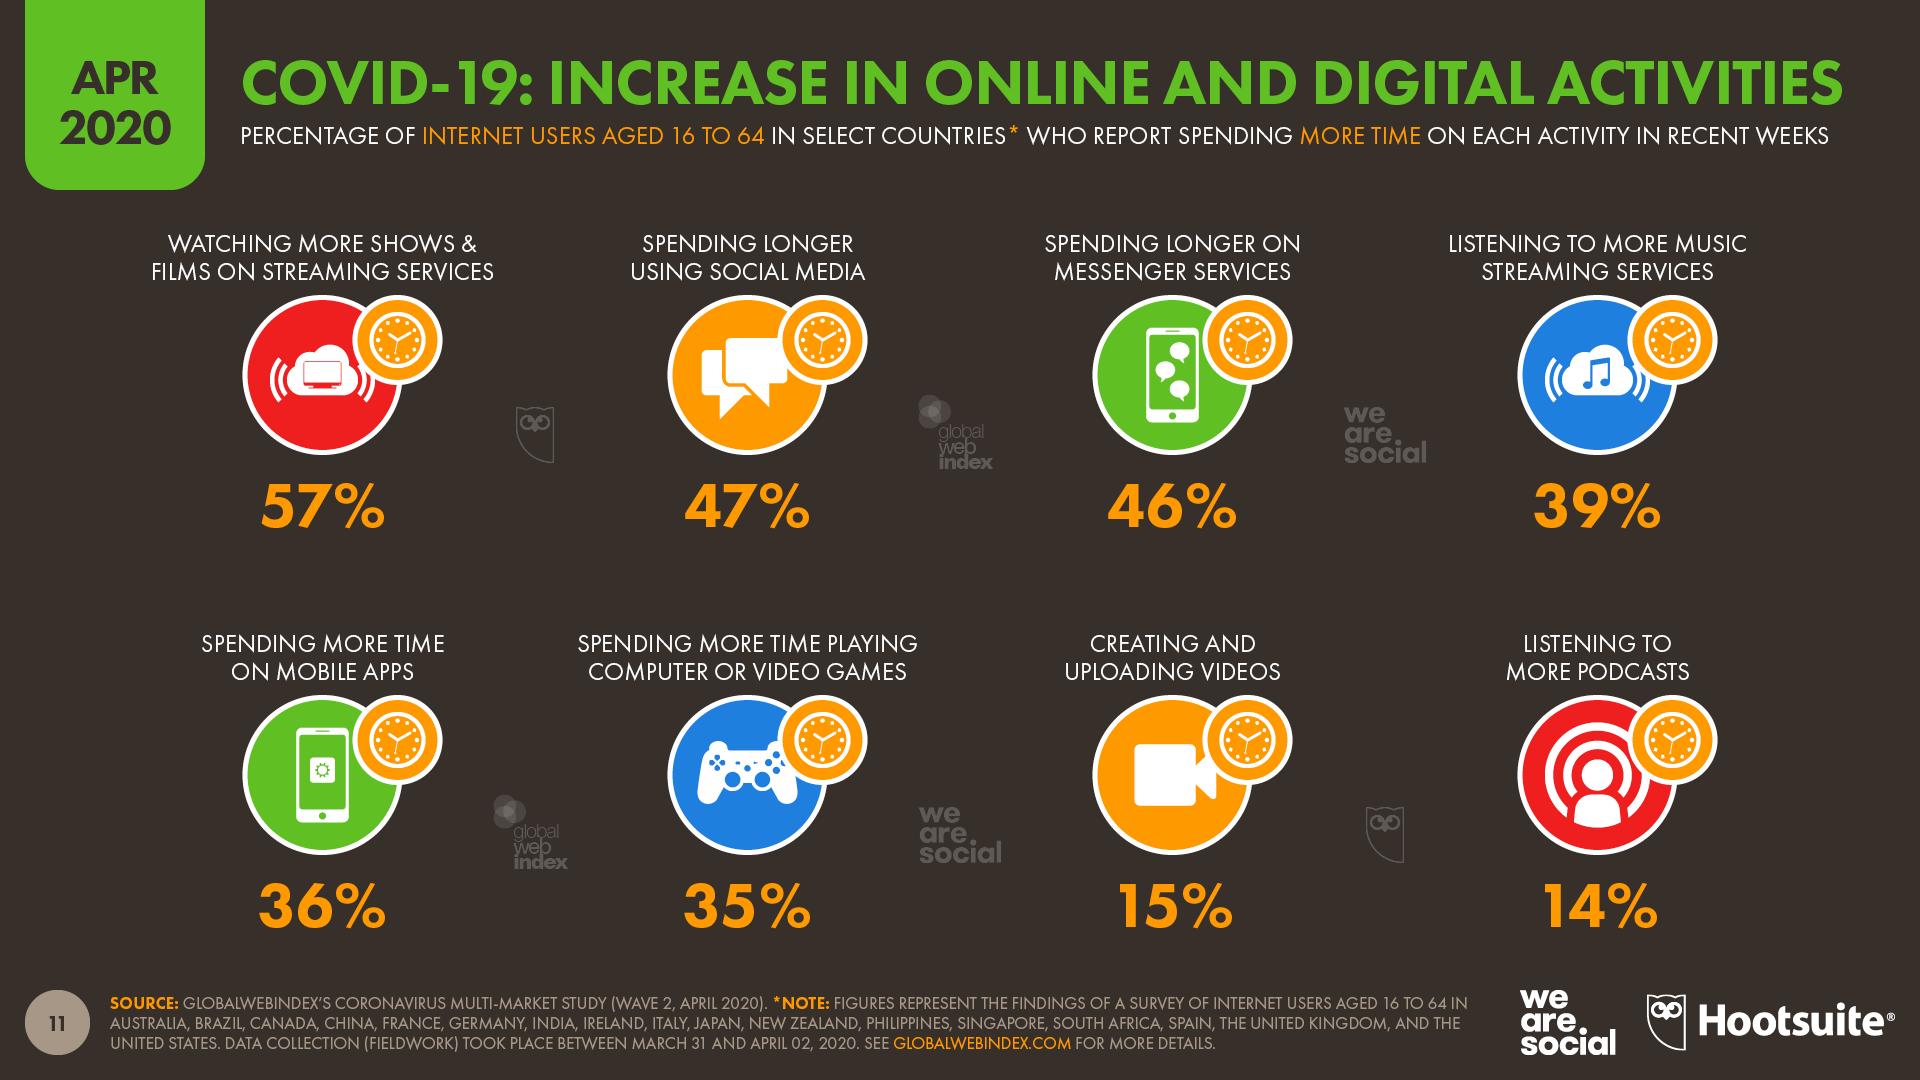
COVID-19 lockdowns have a profound impact on digital habits Beyond increases in device usage, GlobalWebIndex’s data reveals that people’s digital behaviours are also changing dramatically as a result of coronavirus-related lockdowns. We’ll cover many of the individual changes in detail throughout the rest of this article, but the chart below contains the headline numbers.
Many people say that they expect their new habits to continue after the COVID-19 outbreak passes too. One in five internet users say they expect to continue watching more content on streaming services, and one in seven (15 percent) say they expect to continue spending more time using social media.
However, it’s worth remembering that some of these ‘new habits’ are purely the result of a sudden increase in spare time, and there’s a good chance that activity levels will quickly return to pre-lockdown levels once people are able to return to work, and are once again able to socialise with friends and family in the physical world.
Use of social media surges One of the clearest trends in recent weeks has been a dramatic increase in socialising via digital platforms, whether that’s with family, friends, or colleagues and commercial partners.
This isn’t surprising of course; with so many people struggling with social isolation measures or a complete lockdown, digital platforms are increasingly our only opportunity to communicate with the outside world.
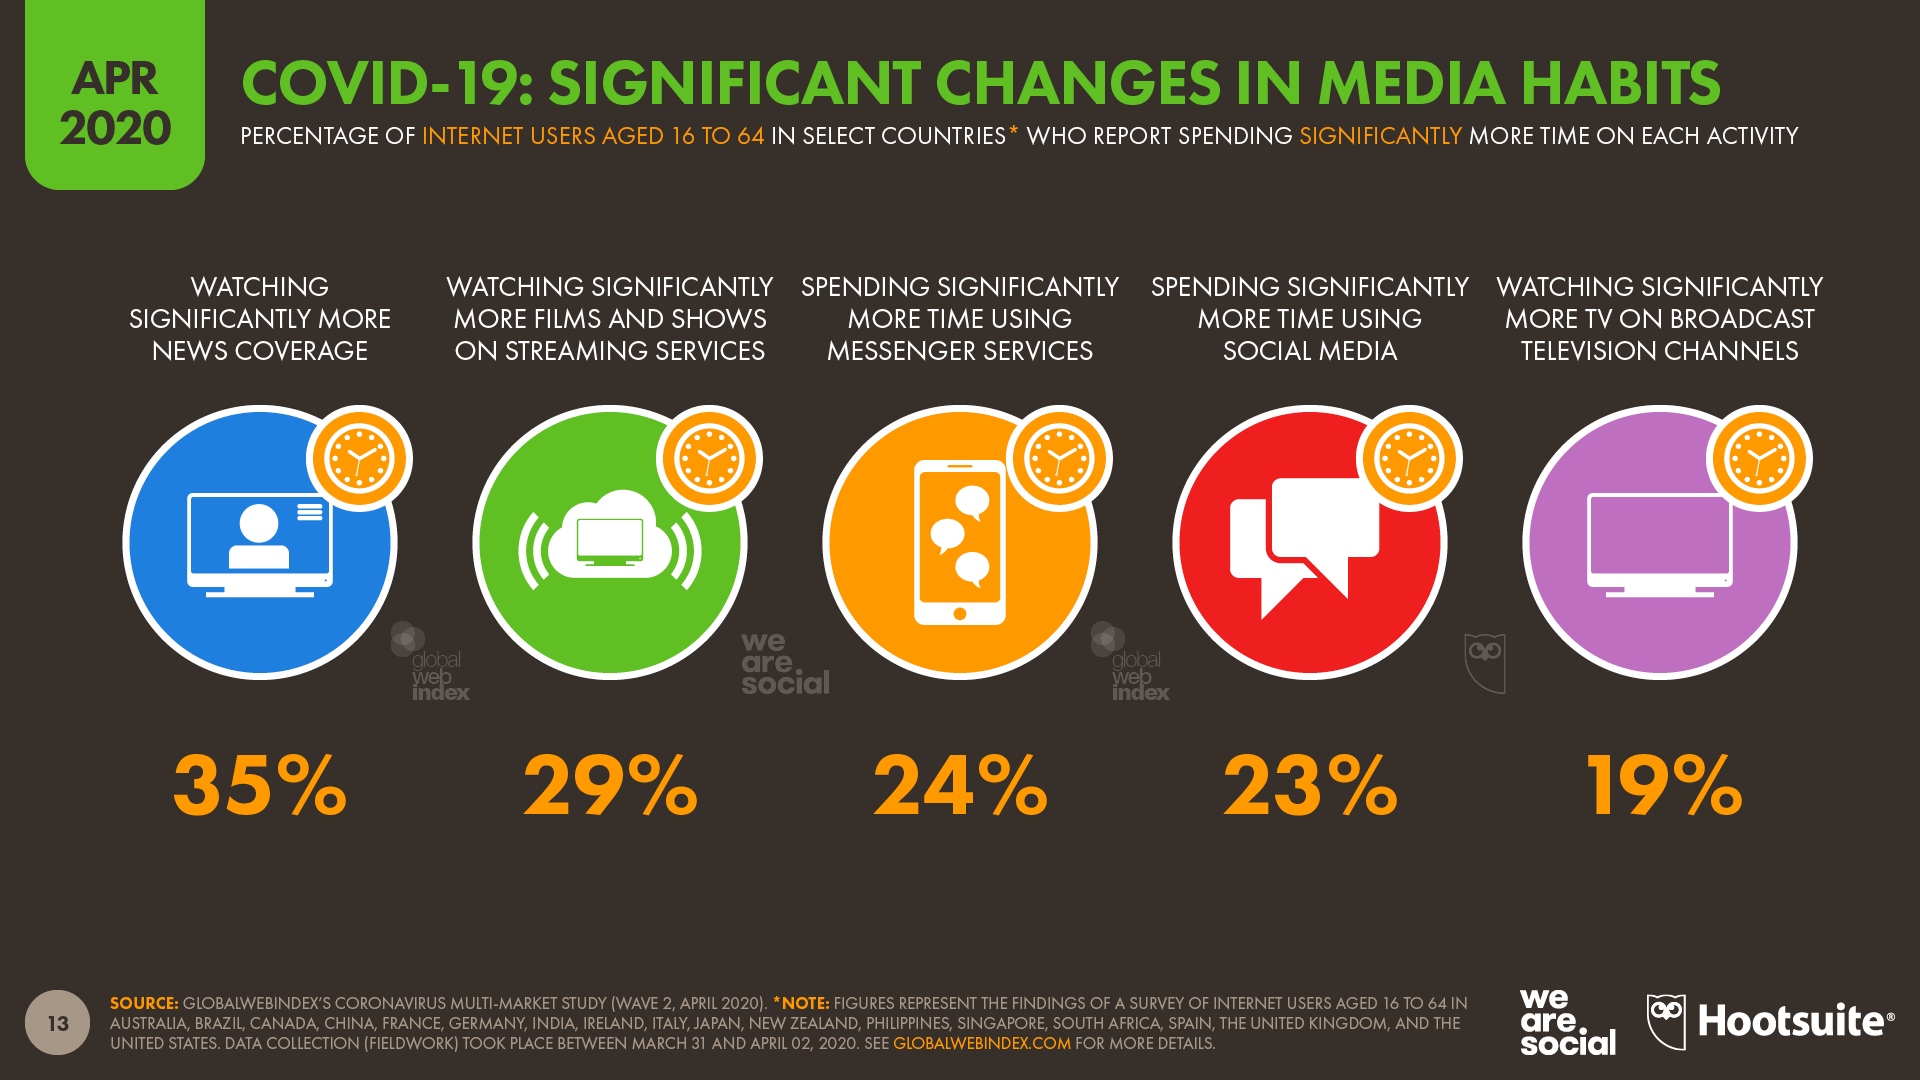
Almost half of internet users (47 percent) in surveyed countries say they’ve been spending longer using social media, while roughly half of these users (23 percent) say they’ve been spending “significantly” more time using social media compared to their pre-lockdown behaviours.
Increased usage has been most pronounced across younger age groups, but a third of internet users aged 45 to 64 also told GlobalWebIndex that they’re spending more time using social media as a result of coronavirus lockdowns.
Women are more likely to have increased their social media activities compared to men, with almost two-thirds of women aged 16 to 24 saying they’re spending more time using social media in recent weeks.
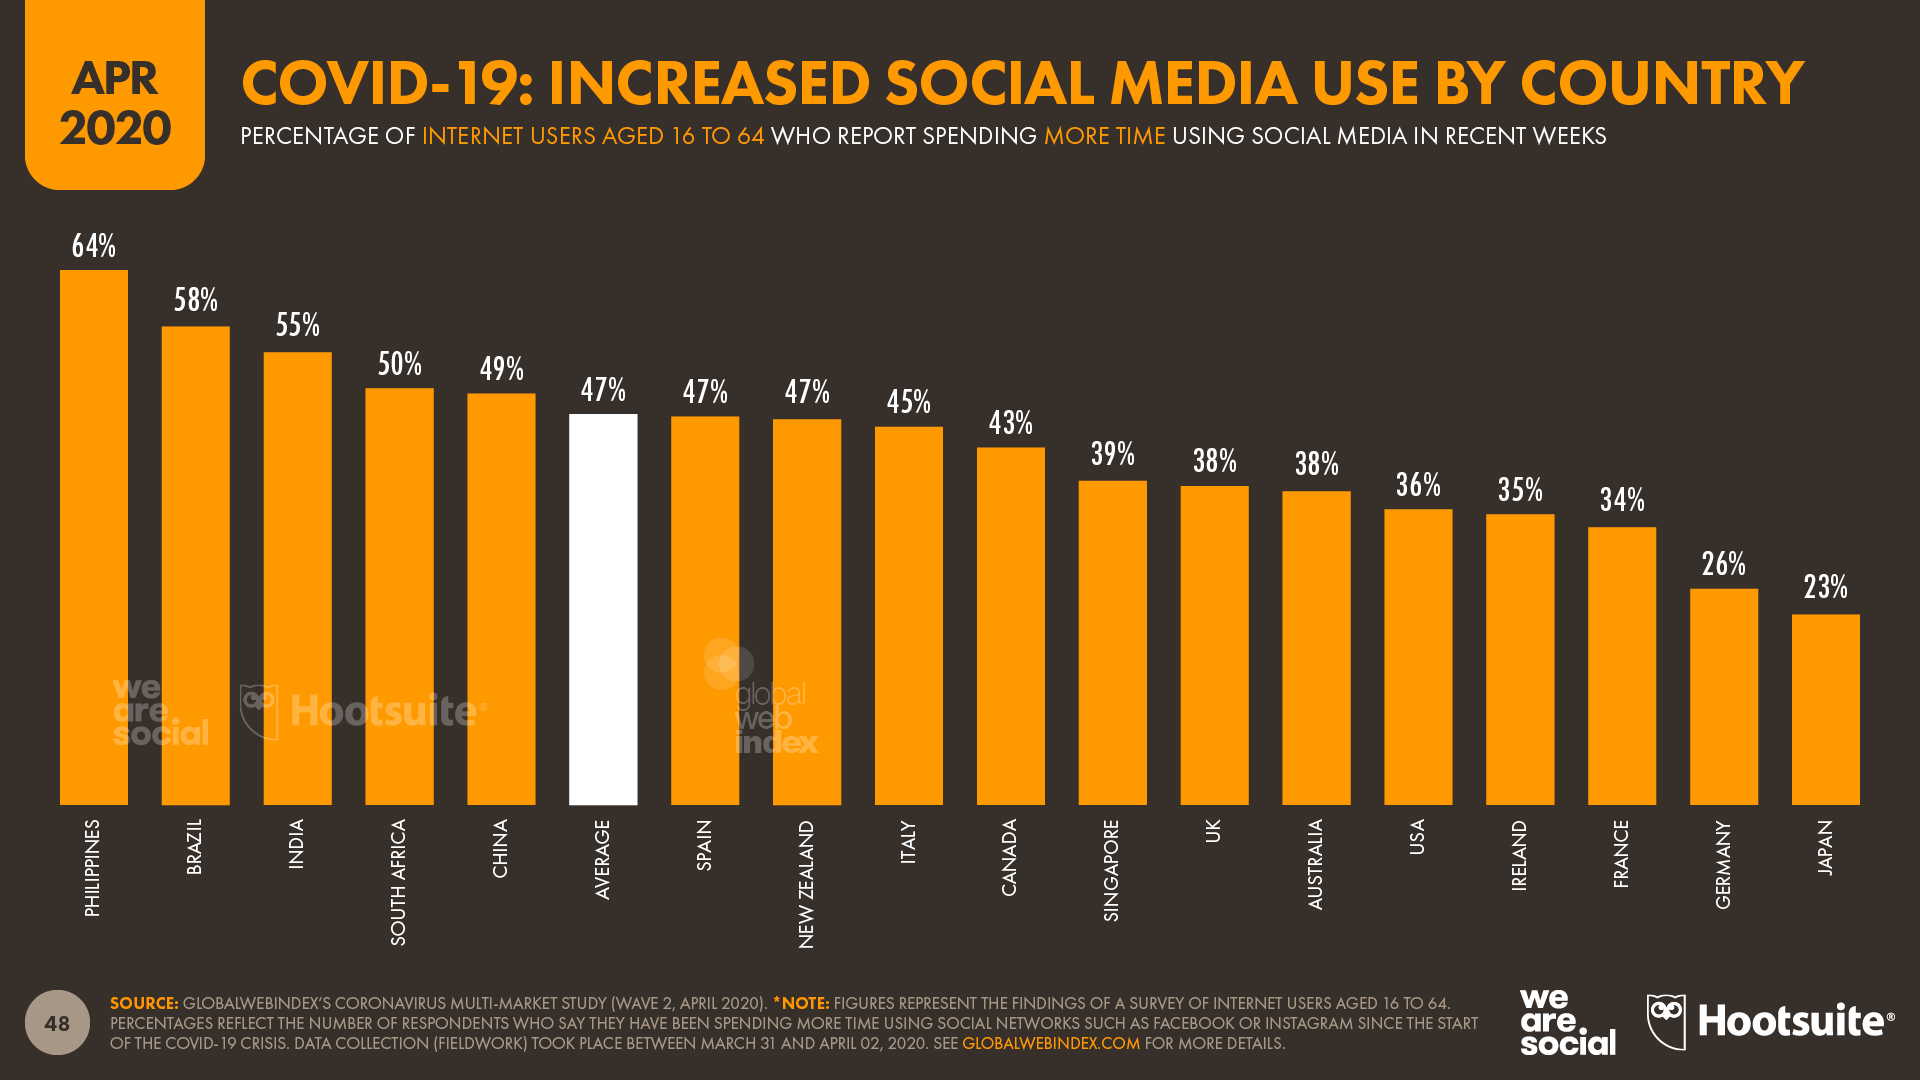
Despite already spending more time on social media than any other country, the Philippines has seen the greatest number of people reporting an increase in the amount of time they’re spending on social platforms.
Almost two-thirds (64 percent) of the Filipinos in GlobalWebIndex’s survey said their ‘social time’ has increased, compared to a global average of 47 percent. More than half of respondents in Brazil, India, and South Africa also report increases in social media activity, compared to less than one-quarter of respondents in Japan, and 26 percent in Germany.
Social media apps already accounted for half of the time that we spent on our mobile phones in 2019, but these ‘old favourites’ have seen considerable increases in use over recent weeks.
In a press call with journalists as early as 18 March, Mark Zuckerberg announced that Facebook had already witnessed twice the usual level of calls made via WhatsApp and Facebook Messenger in the days since European countries began their lockdowns.
Meanwhile, some countries have seen even greater jumps in use. In Italy – one of the first Western countries to experience a complete lockdown – the number of group calls on Facebook Messenger involving three or more users increased by more than 1,000 percent in March alone, while people across the country have also increased the time they spend using Facebook-owned apps by more than 70 percent since the lockdown began.
App Annie also reports that the amount of time people spend using Snapchat and TikTok has grown considerably over recent weeks, while Reddit has also reported increases of 20-50% in traffic to subreddits related to business, finance, news, education, travel, and sports.
Social media platforms see solid growth in active users In addition to these increases in time spent, the latest data suggest that all of the key social platforms that we track in our ongoing Global Digital Reports grew their active user bases over the first three months of 2020 as well.
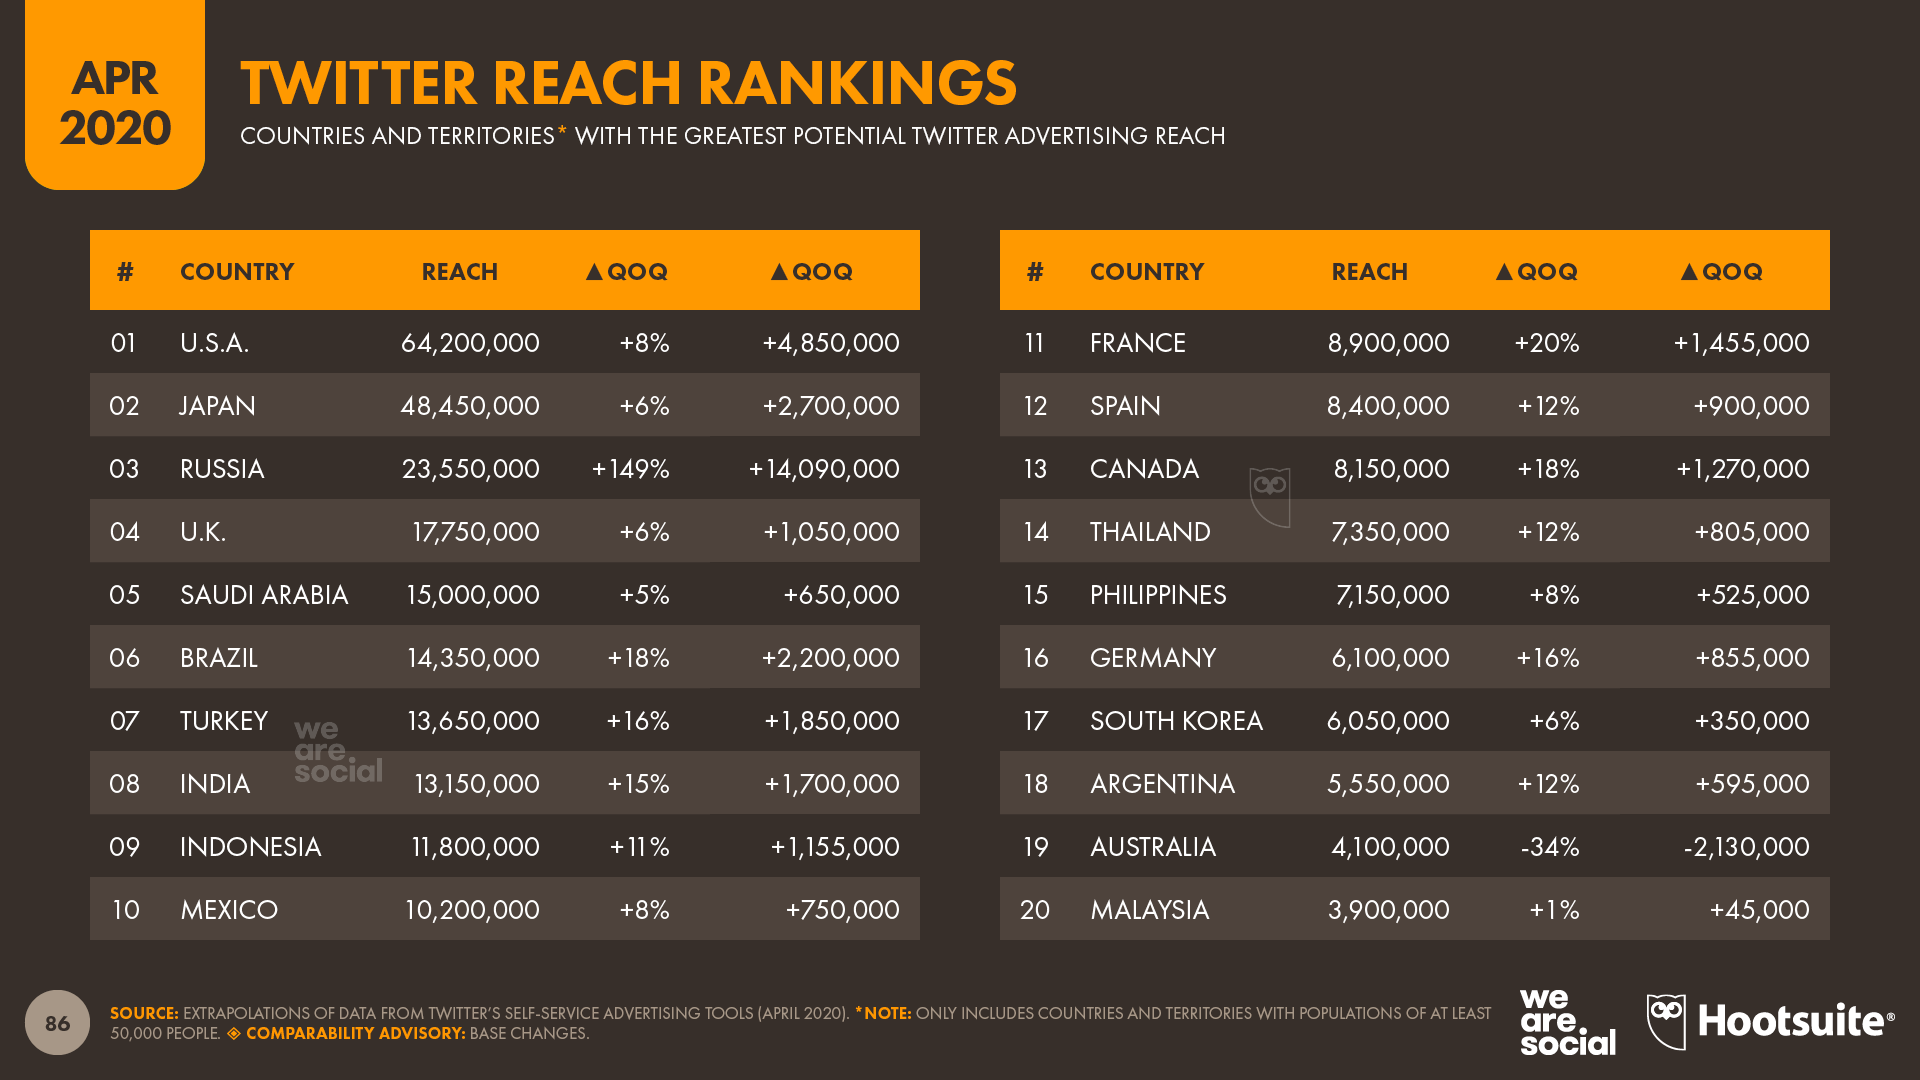
Twitter saw the biggest quarterly jump amongst these platforms. Numbers published in the company’s self-service advertising tools show that advertisers can now reach 47 million more people on Twitter compared to January 2020, equating to a quarter-on-quarter increase of 14 percent.
Interestingly, Russia accounted for roughly 30 percent of Twitter’s global growth this quarter. The company’s data show that the number of people in the country that advertisers can reach using Twitter ads increased by 149 percent over the past three months, from 9.5 million in January 2020, to more than 23.5 million by the start of April.
Facebook’s advertising audience also grew in the first three months of 2020, and is up by almost 4 percent since January (more on this below). Instagram’s audience is growing even faster, registering an uplift of 4.5 percent since the start of the year, while Snapchat’s tools indicate that the platforms’ advertising audience grew by 4.2 percent during the same period.
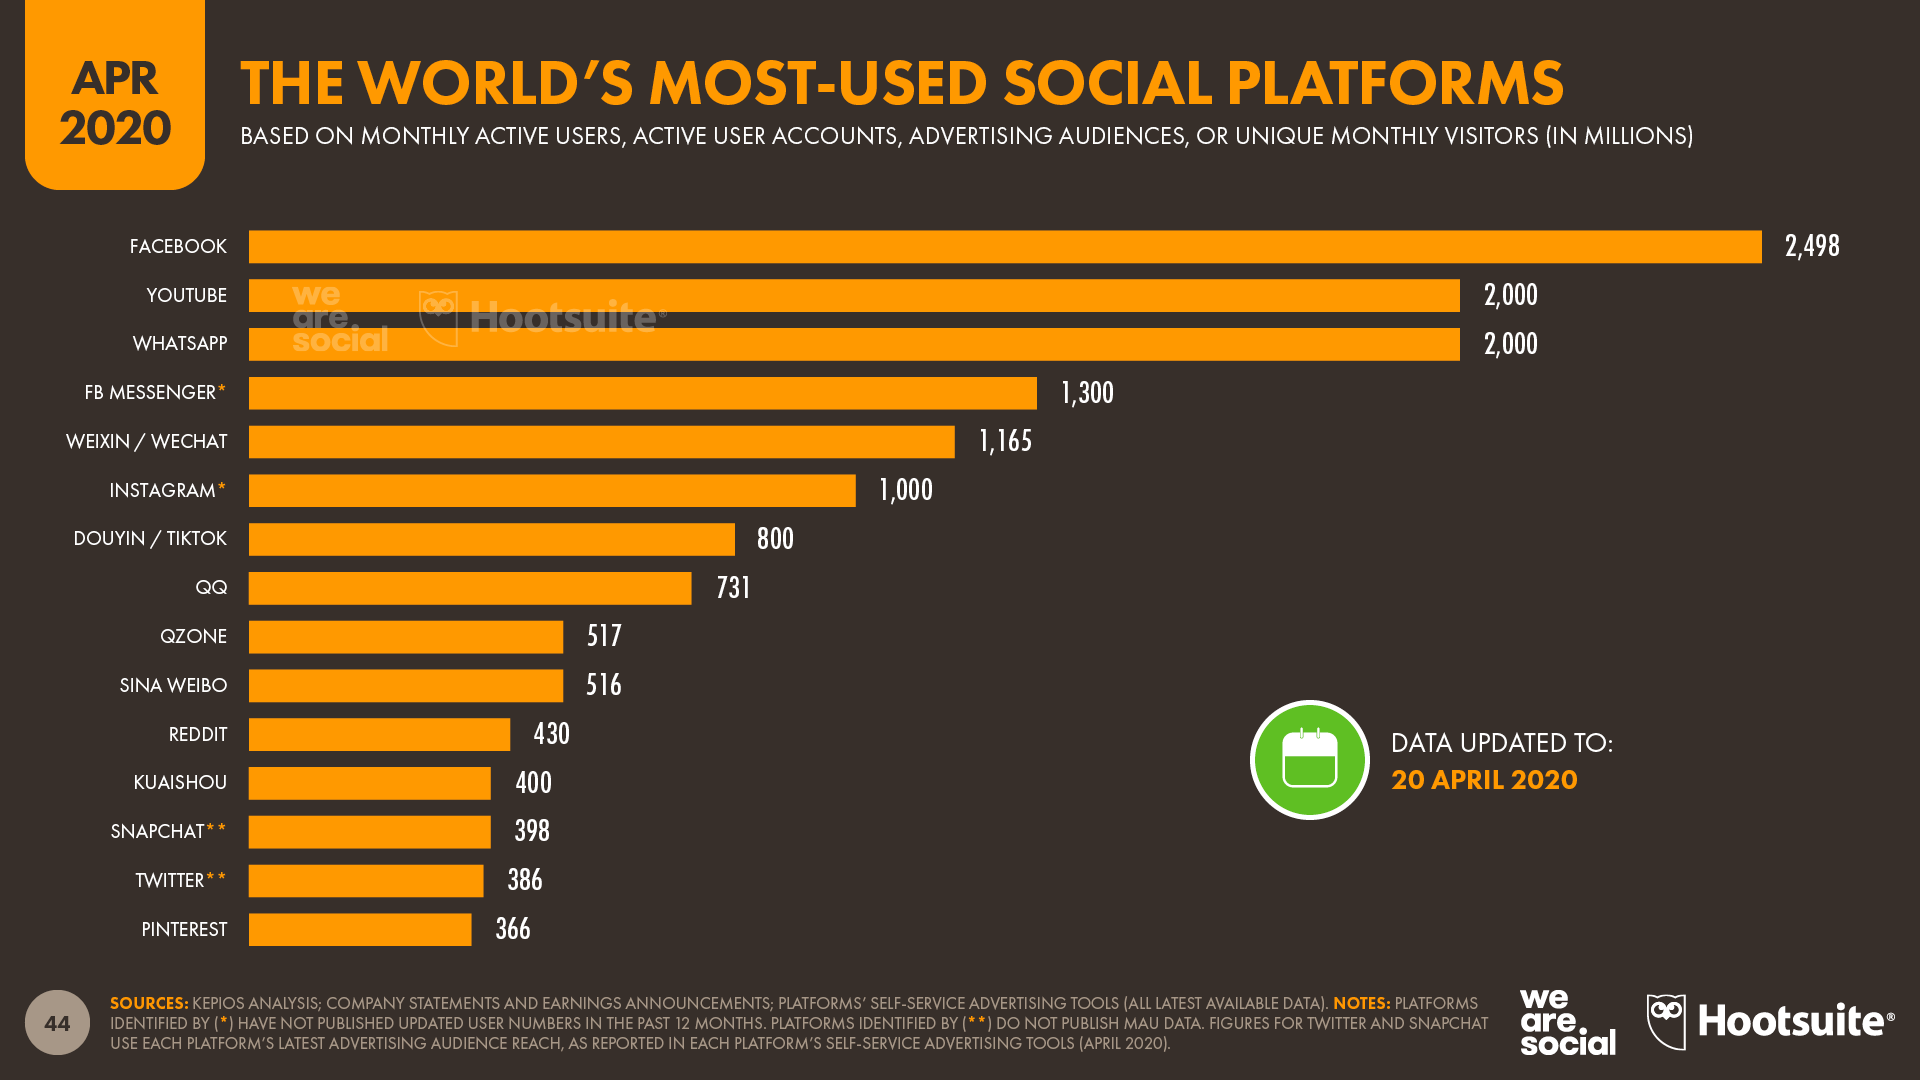
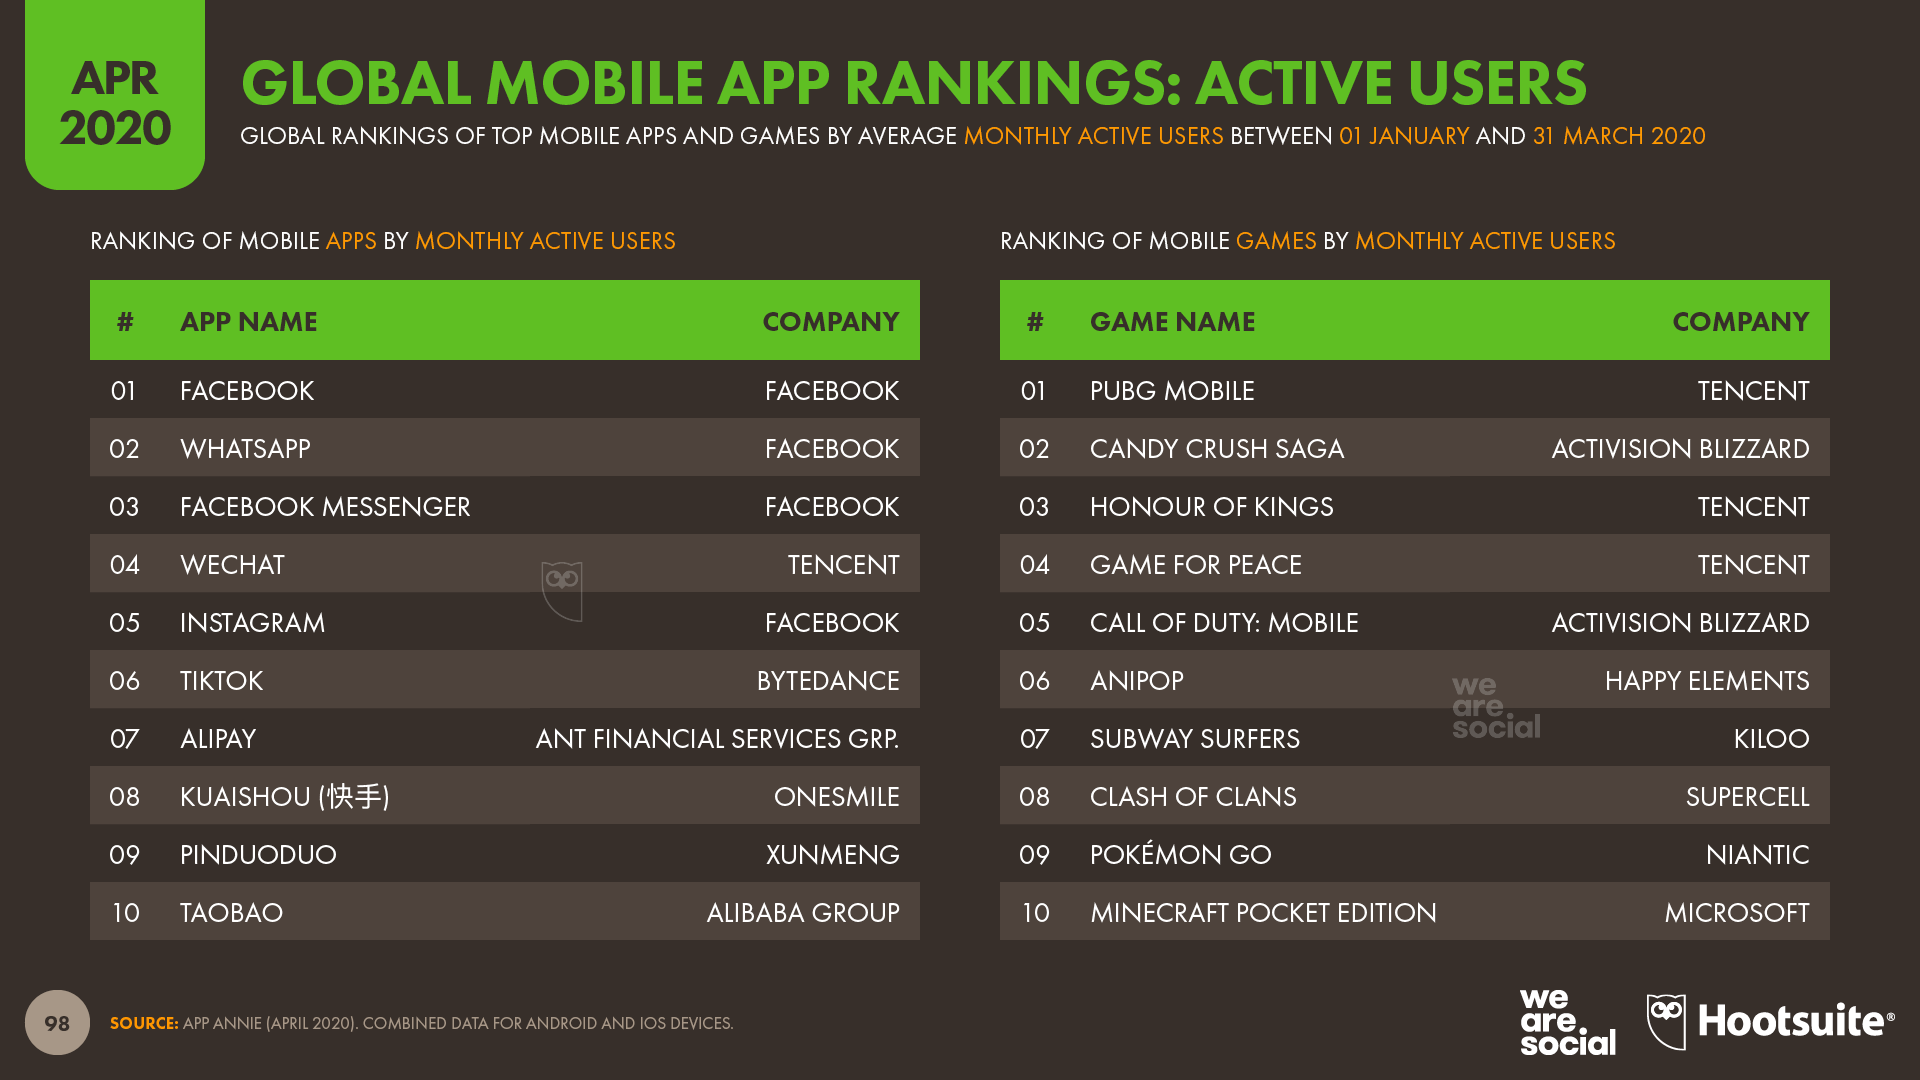
Sadly, TikTok remains tight-lipped on active user numbers, so we’re unable to provide any new insights that would enable us to compare the platform’s growth directly to other platforms. However, the latest data from App Annie show that TikTok still trails Instagram when it comes to monthly active users of each platform’s mobile app.
Is video calling the future of social media? In addition to their usual ‘portfolio’ of social apps, people have also been turning to new platforms and solutions to help with the unique challenges that the pandemic has created. In particular, video conferencing apps have quickly moved to the centre of many people’s work lives, and many users have been using these platforms to stay in touch with friends and family too.
Despite lingering concerns about privacy, teleconferencing service Zoom has been a clear winner, with the company revealing that it’s had as many as 200 million daily active users in recent weeks – 20 times more than pre-pandemic levels.
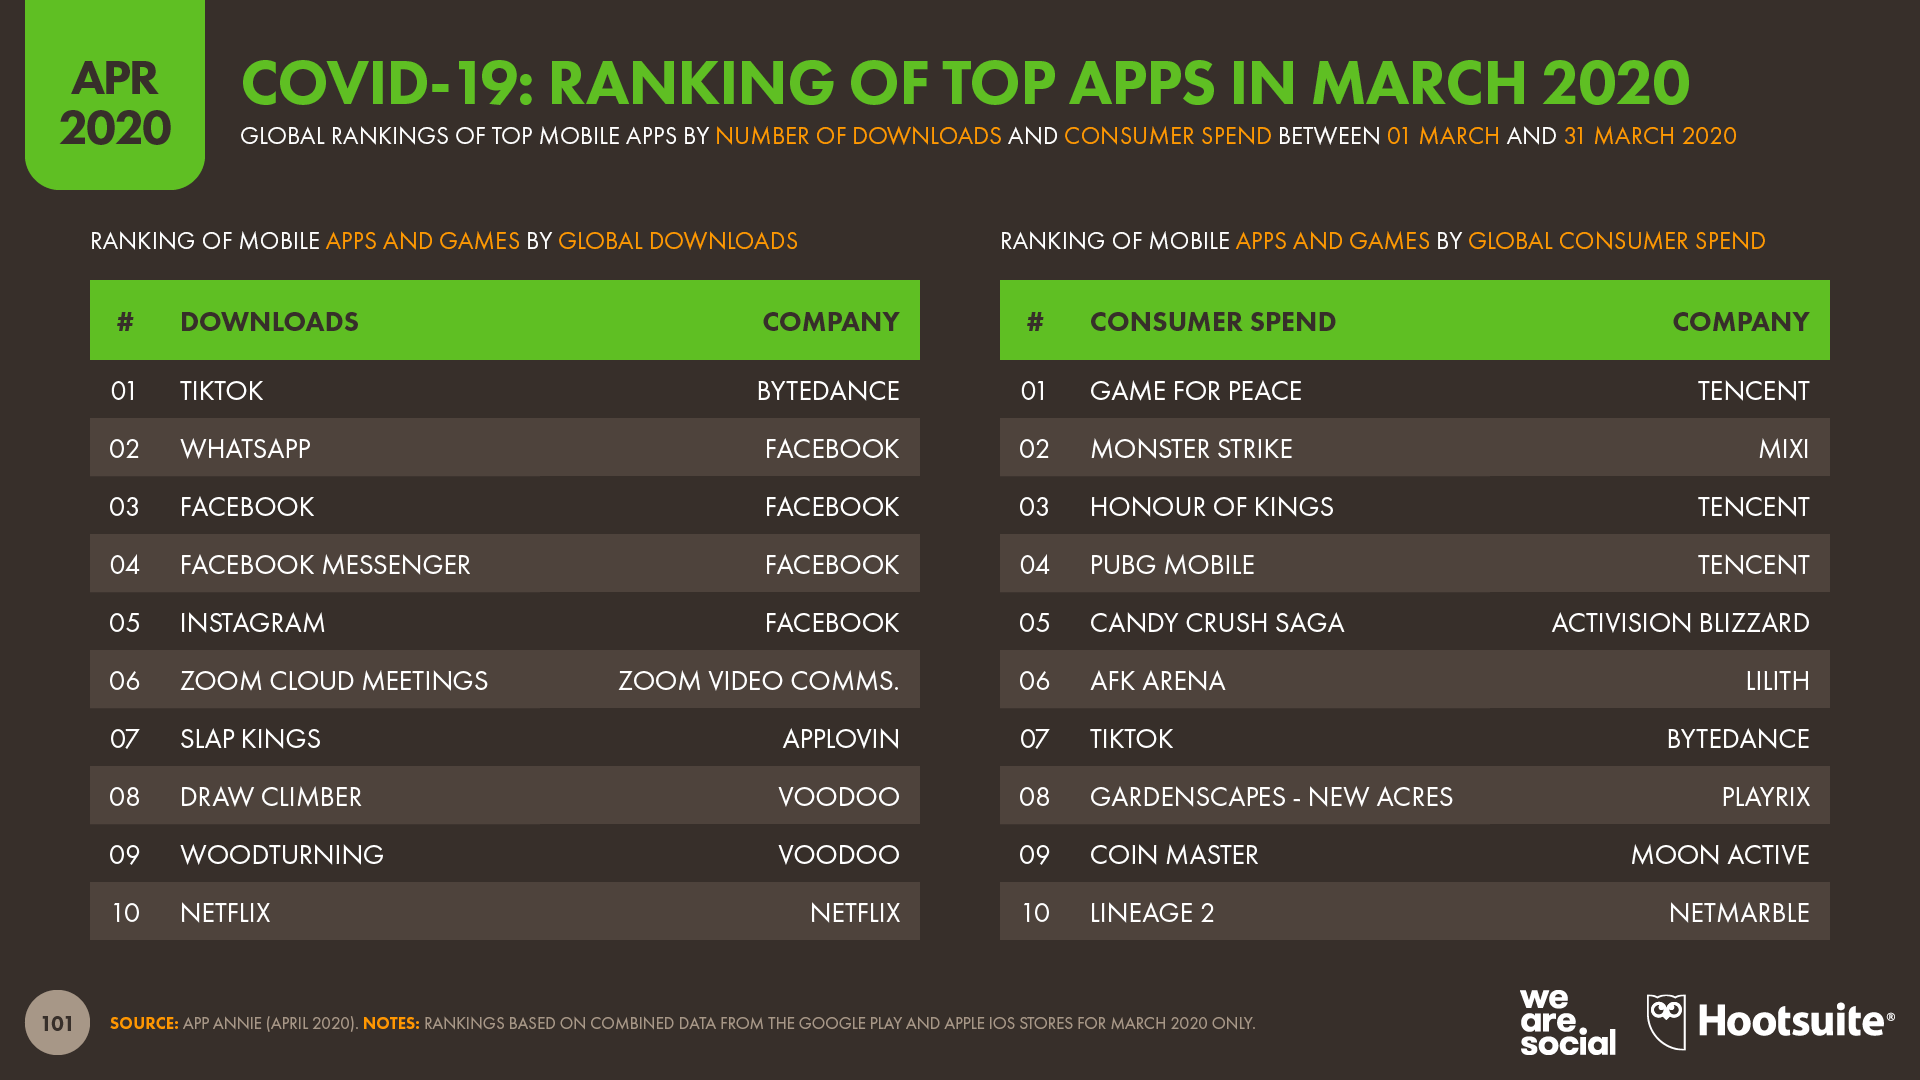
The latest reports from App Annie also reveal that Zoom was one of the ten most-downloaded apps around the world in March 2020, with the app generating a greater number of downloads than Netflix.
Zoom isn’t the only video calling app that’s seen adoption accelerate in recent weeks though. App Annie reports that Google’s Meet app (until recently known as Hangouts Meet) saw 30 times as many downloads in the USA in the week of March 15th to 21st compared to pre-pandemic levels. Downloads of the app also increased dramatically in Europe, with Italy registering 140 times as many downloads, Spain 64 times as many, and the UK 24 times as many.
Houseparty has been another big winner, especially amongst younger users who’ve been unable to meet up with friends during the lockdown. App Annie reports that downloads of the Houseparty app in Spain jumped by a factor of 2,360x in the week of March 15th to 21st. Italy saw an increase of 423x, while the UK, which started from a higher base of existing users, still saw downloads jump by 17x.
It’s unclear to what extent these new behaviours will continue once lockdowns have been lifted and people are able to socialise in person again, but with many people now using these platforms multiple times each day, it’s likely that significant numbers of people have already overcome key barriers to trial and adoption.
As a result, there’s a real likelihood that many of the social media habits that people have formed in recent weeks will outlast the pandemic, and a move to more ‘face-to-face’ digital interactions may be an important legacy of coronavirus lockdowns on the world’s social media behaviours.
Advertisers can now reach more than 2 billion people on Facebook The latest numbers published in Facebook’s self-service advertising tools reveal that advertisers can now reach more than 2 billion people around the world on the company’s core platform – the first time we’ve seen audience numbers reach this milestone during our ongoing tracking.
If we assume that all of these users are at least 13 years old – as required by the platform’s terms of service – these figures would mean that advertisers can now reach more than one-third of the world’s total population aged 13 and above using adverts on Facebook.
Compared to the advertising audience numbers that we reported in our Digital 2020 Global Digital Overview report in January, an additional 76 million people saw adverts on Facebook in March 2020 compared to December 2019.
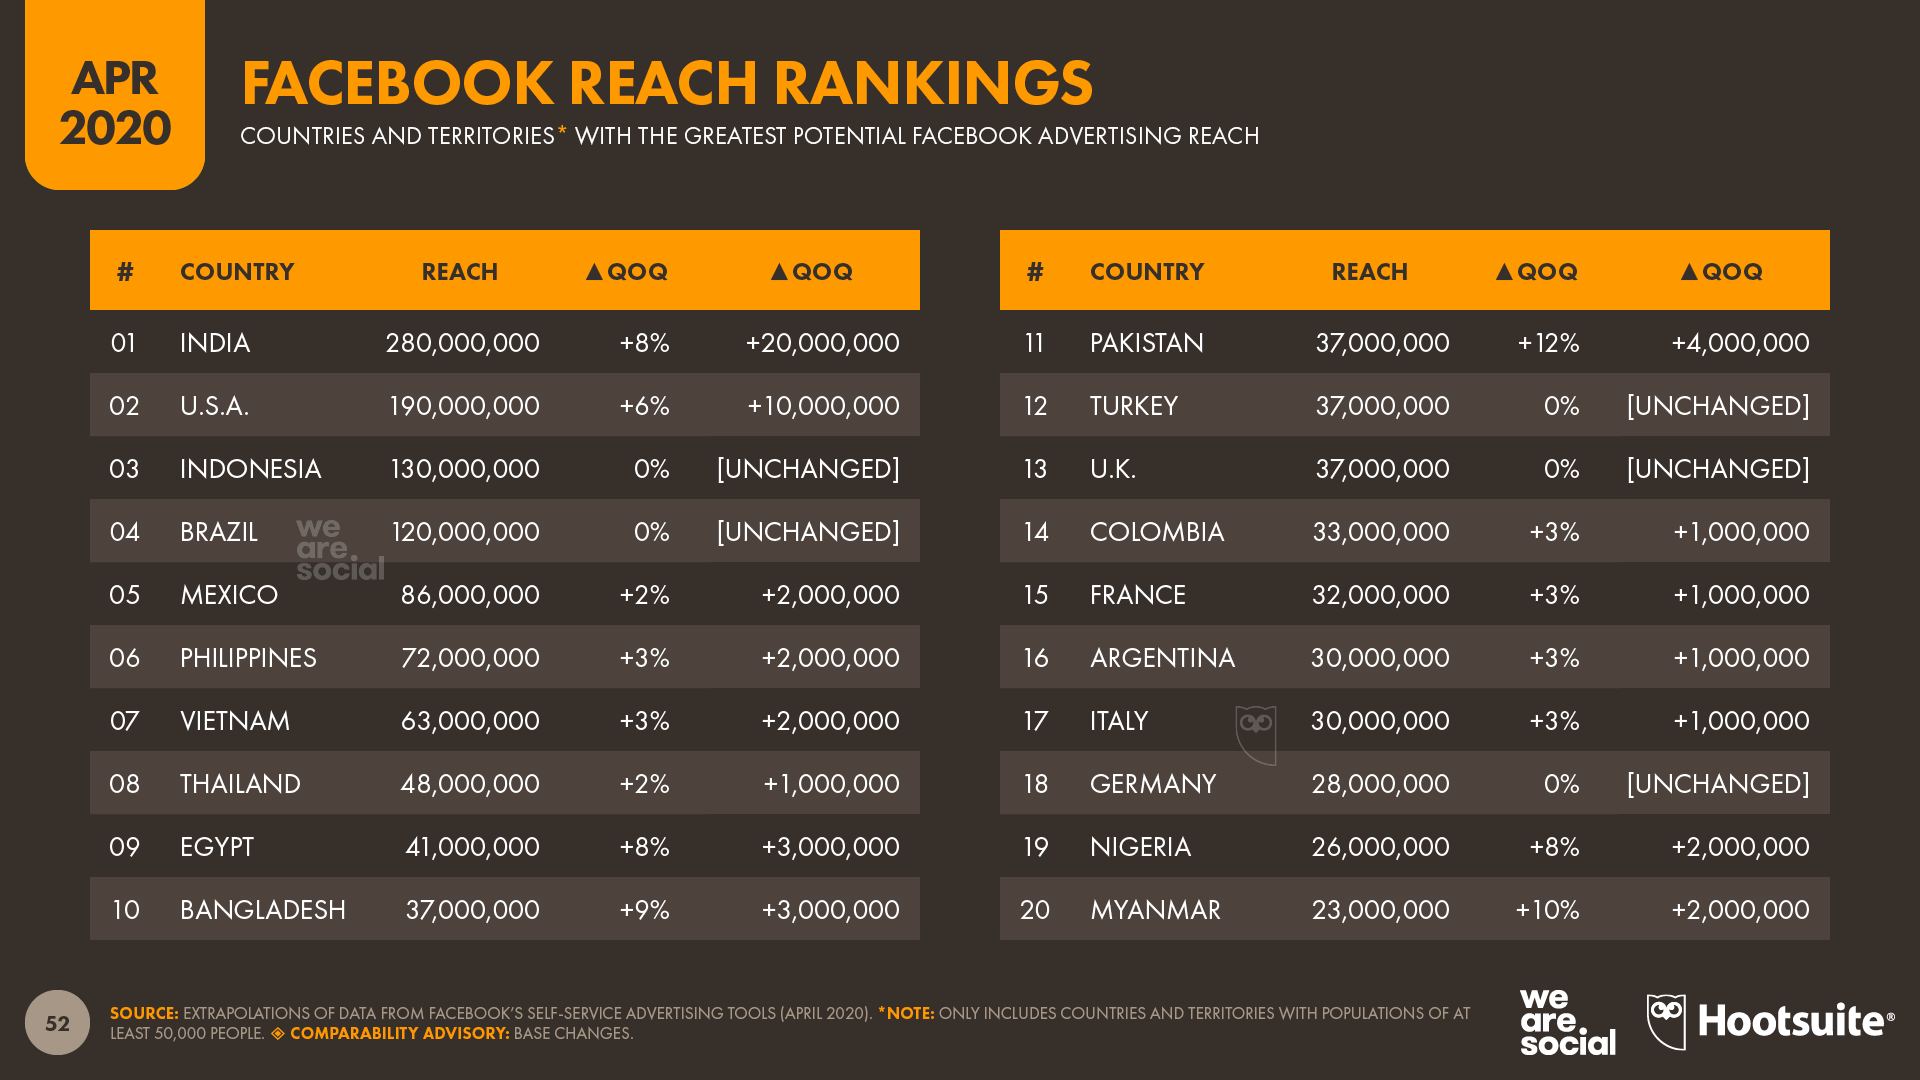
Much of this growth was fuelled by strong gains in the platform’s two largest countries. Advertisers can now reach 280 million people on Facebook in India, up by 20 million since January this year. The platforms’ US audience also grew by 10 million over the past three months, reaching a total addressable audience of 190 million people.
It’s not just the platform’s audience numbers that have grown either; as we’ll explore in more detail in the next sections, the platform’s users are clicking on a greater number of adverts too.
However, the latest numbers also suggest that just 80 percent of Facebook’s active users saw an advert in the past 30 days, which means that the platform was unable to monetise roughly 500 million of its 2.5 billion monthly active users during that time.
There may be many reasons for a disparity between advertising audience numbers and total monthly active users. One important consideration is the impact of American sanctions on countries such as Iran, Cuba, and Sudan, which prevents US companies from selling advertising in these locations.
However, user behaviours may also play a role, especially if people bypass the platform’s main feed by only checking their notifications, or heading straight to Groups.
Advertising’s perplexing paradox Various reports over recent weeks have highlighted significant downward pressure on the cost of digital advertising as economies struggle.
Both the Wall Street Journal and Digiday cite various sources who report that the cost of advertising impressions on Facebook, Instagram, and YouTube have all declined by 15 to 20 percent between February and March 2020. Meanwhile, an article in the New York Times suggests that drops may have been even more precipitous, with one source reporting a fall of between 35 and 50 percent in the cost of Facebook ad impressions.
Facebook itself has already announced that its business will be adversely affected by the coronavirus pandemic too. In particular, the company advised investors that recent increases in user activity may not translate into equivalent increases in ad revenue, stating:
“Facebook doesn’t monetize many of the services where we’re seeing increased engagement, and we’ve seen a weakening in our ads business in countries taking aggressive actions to reduce the spread of COVID-19.”
Analysts Cowen & Co have offered their analysis on this “weakening”, forecasting Facebook ad revenue for 2020 to be US$68 billion – almost US$16 billion (19 percent) lower than their previous forecast. They offered similarly pessimistic changes to their forecasts for Google’s performance too, predicting that the company’s net revenues in 2020 will be US$127.5 billion – 18 percent lower than their previous estimate.
However, other data tells a different story.
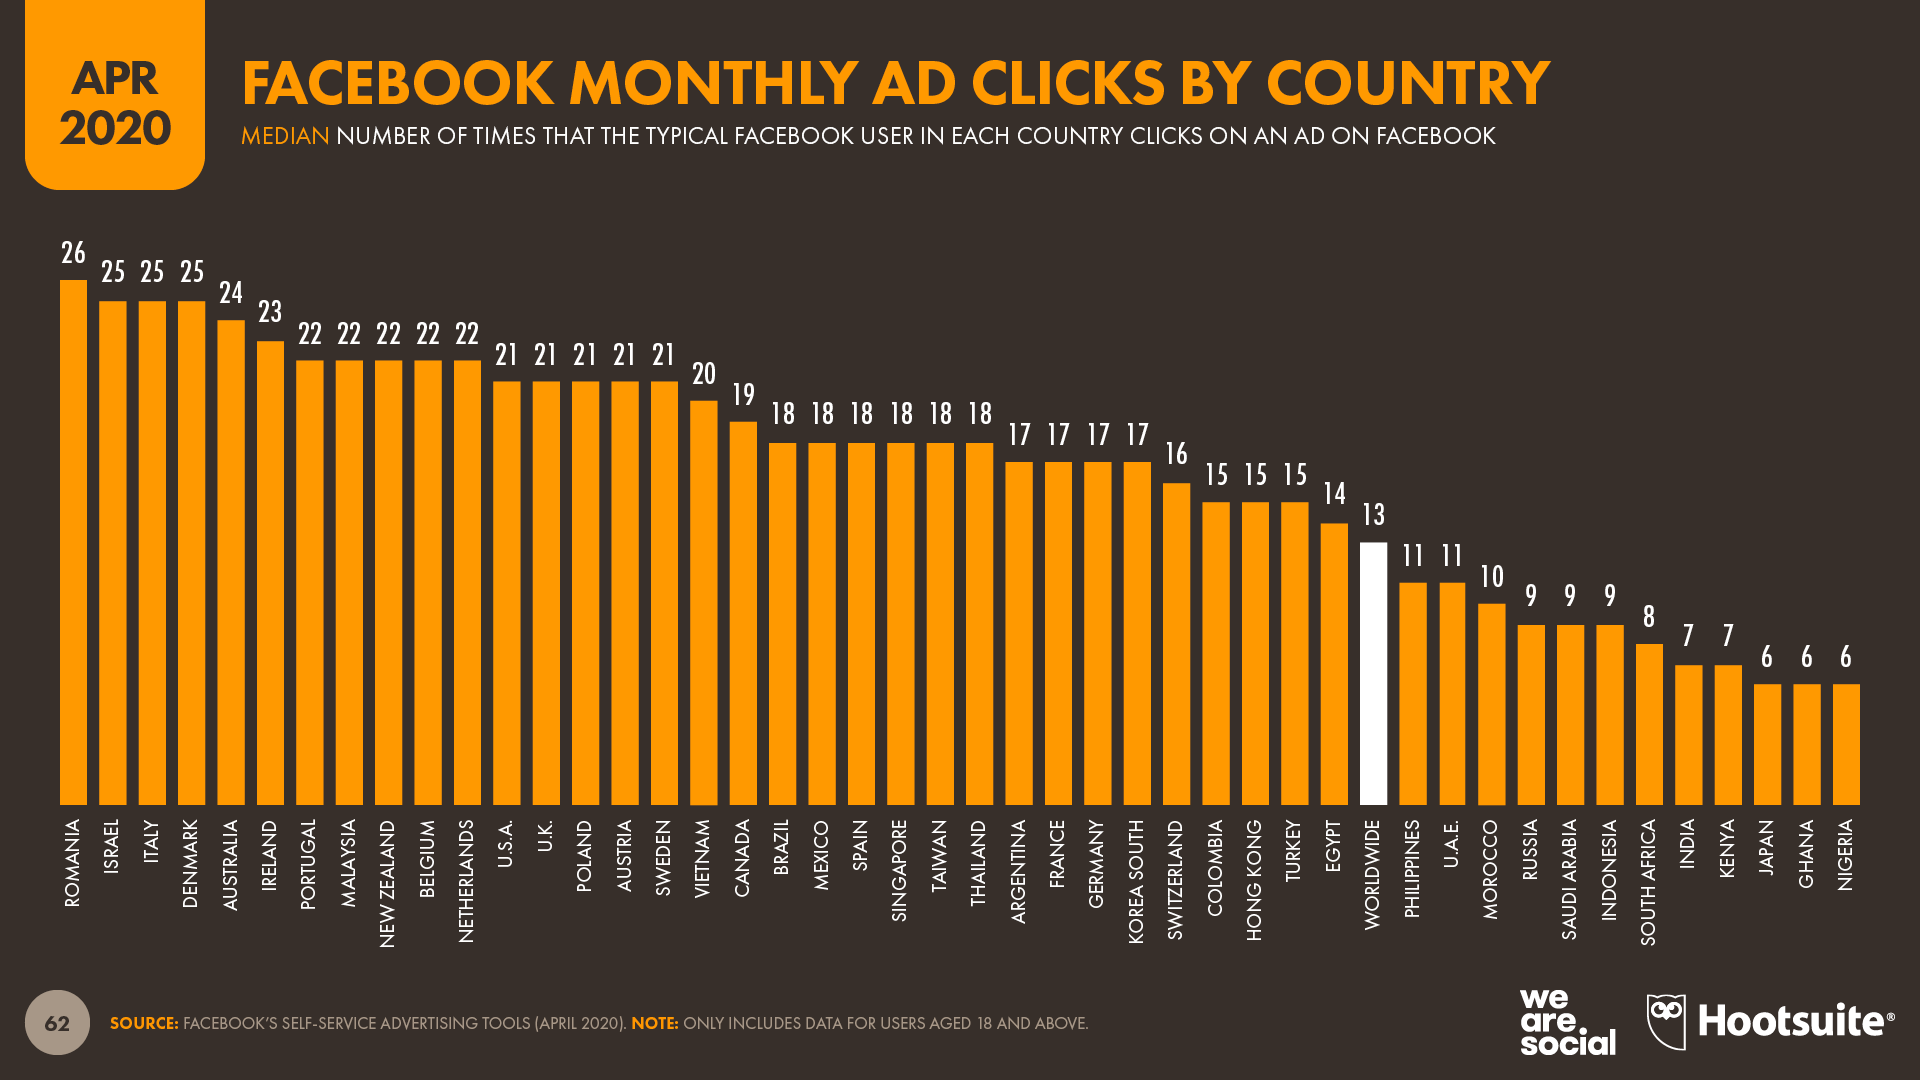
Facebook’s ad planning tools indicate that users have been clicking on more adverts on the platform in recent weeks compared to the end of 2019, both relatively and absolutely. The platform’s latest data show that the typical global Facebook user clicked on a median of 13 adverts in March 2020, up from December 2019’s median of 12.
While that may not sound like much of an increase, our analysis of country-level data suggests that this may have translated into more than 3.5 billion additional clicks on Facebook ads in March 2020 compared to December 2019 activity. Furthermore, because this calculation is based on medians (as opposed to averages), the actual increase may be even higher.
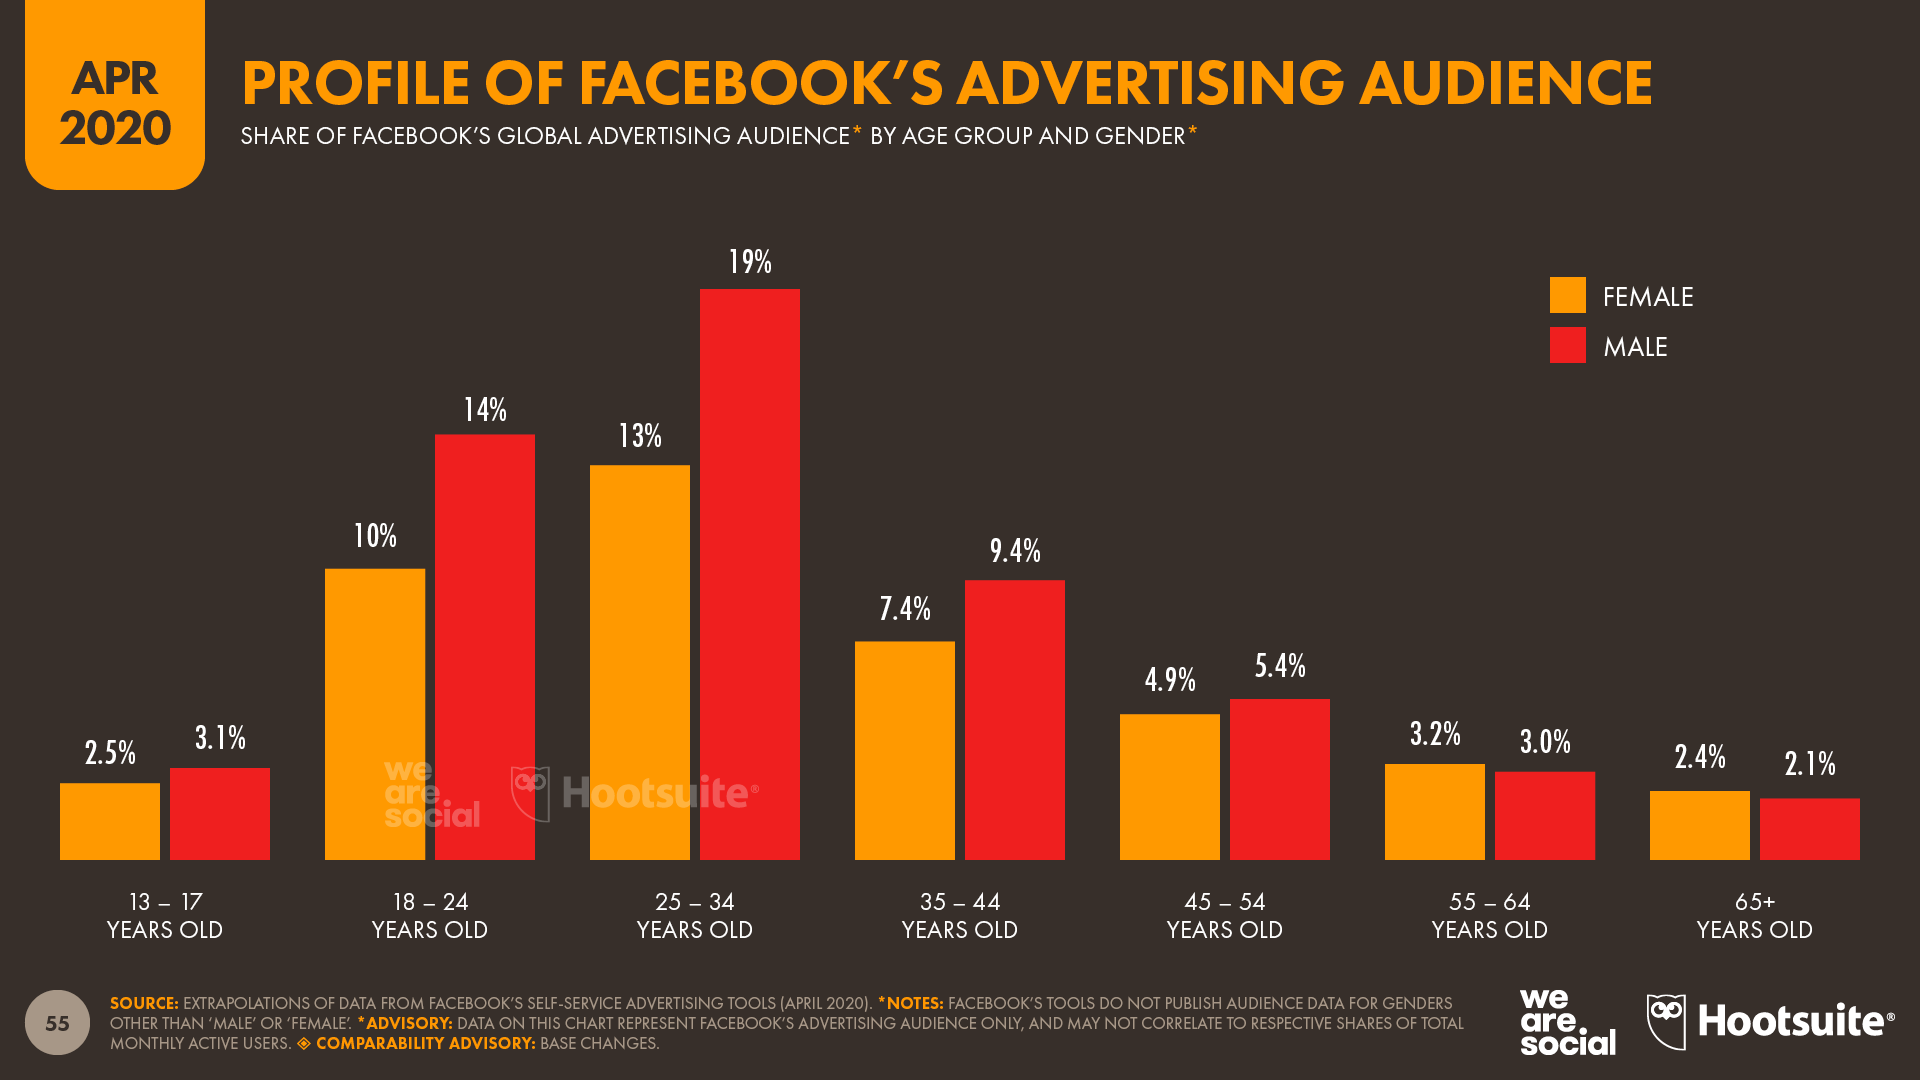
Overall, women are significantly more likely to click or tap on Facebook adverts compared to men, while people between the ages of 35 and 65 also show greater propensity to engage with commercial messages on the platform.
Younger users are the least likely to interact with ads, with Facebook’s own data showing that users aged 18 to 24 click or tap on a median of just 10 adverts per month, compared to an overall median of 13 ad clicks per month across the platform’s total user base.
However, the latest data suggest that – across all age groups – ad engagement has increased in recent weeks, potentially because people have been spending longer using social media. Data published in Facebook’s ad planning tools show that the median number of monthly ad clicks has increased in 194 countries out of 219 countries we’ve been able to analyse.
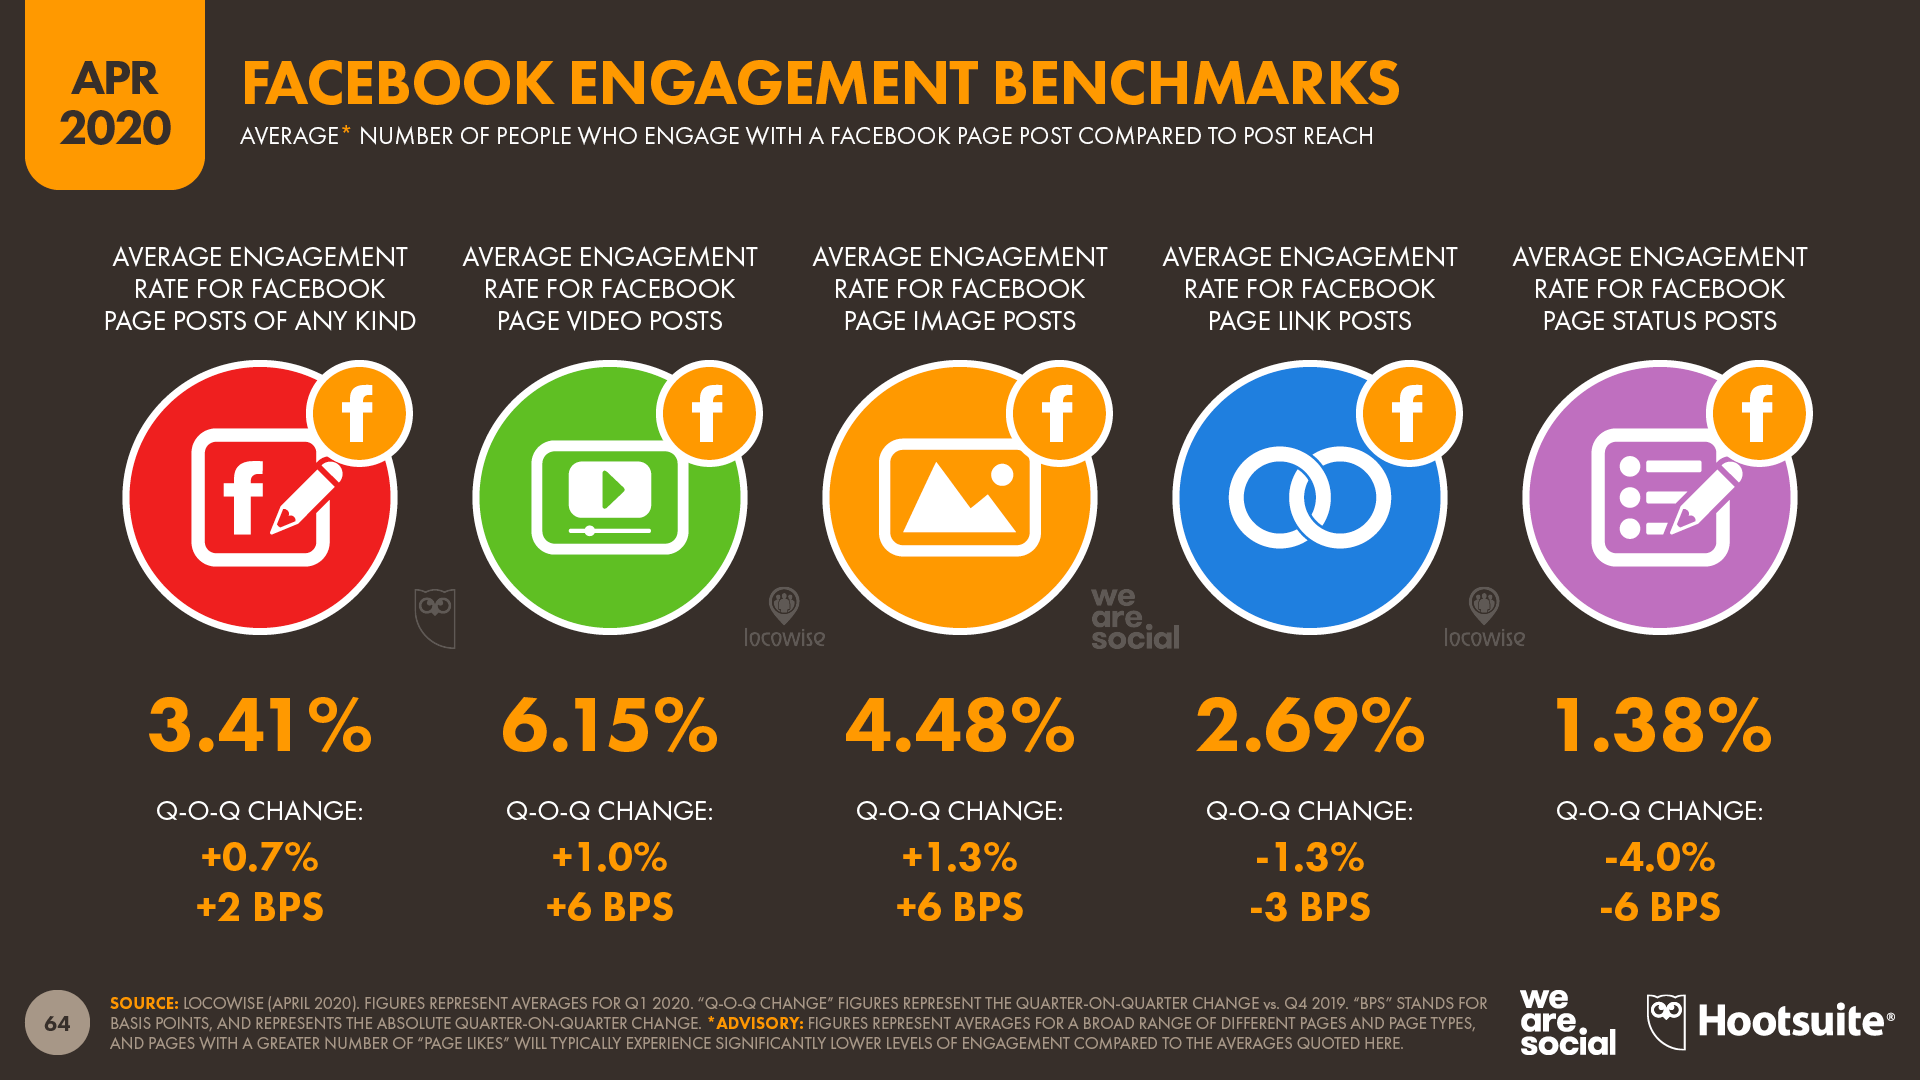
Furthermore, the latest data from Locowise show that overall engagement levels for posts made by Pages on Facebook have increased over the past three months, although this is not true of all post format types. Critically, photo and video posts – formats that are particularly popular for paid media campaigns on Facebook – have seen average engagement rates increase by at least 1 percent over the past three months.
So, while most marketers are likely battling with downward pressure on their ad budgets as a result of ongoing economic woes, the good news is that the cost of digital advertising appears to have gone down, while the likelihood that audiences will engage with those adverts has simultaneously gone up.
These trends suggest that – if you’re able to secure budget – the current opportunities offered by digital advertising may be particularly compelling, especially compared to pre-pandemic performance.
But should brands even be thinking about advertising at this time?
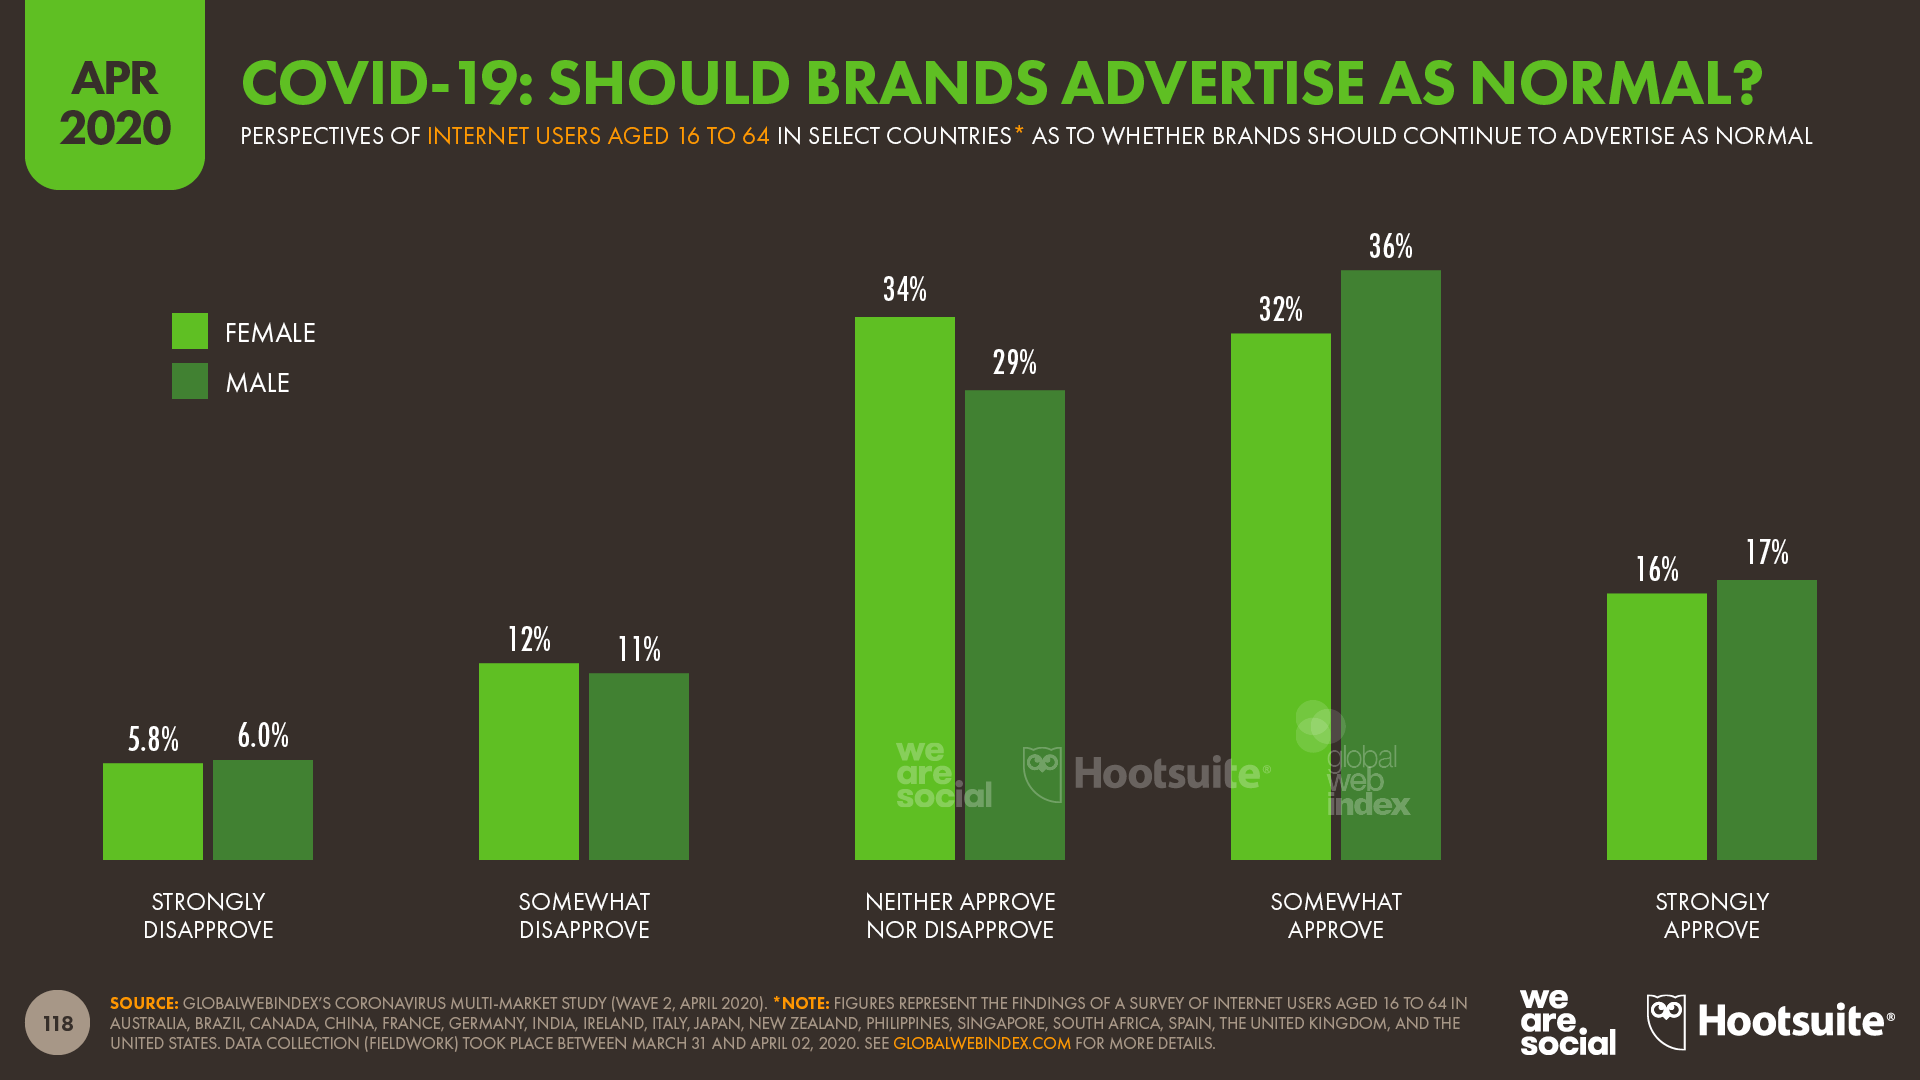
People don’t expect brands to stop advertising Research from GlobalWebIndex shows that more than half of internet users (51 percent) approve of brands continuing to advertise as normal despite the Coronavirus outbreak, compared to less than one in five (18 percent) who say they disapprove. Just under a third (31 percent) say they neither approve nor disapprove.
These findings are supported by research from Kantar, which found that only 8 percent of people believe that companies should stop advertising, compared to 64 percent of respondents who said they think it’s acceptable for brands to continue with commercial messaging.
GlobalWebIndex’s data suggests that men have a more favourable attitude towards companies continuing to advertise as normal, but men and women in older age groups are more likely to disapprove.
Perceptions also vary considerably by country, although it’s interesting to note that respondents in Italy and Spain – two countries that have been particularly hard-hit by the current crisis – appear to be more supportive of brands continuing to advertise.
However, brands need to be careful how they approach advertising during the crisis, and research from Edelman found that one in three consumers have already “punished” brands that they perceived to have responded badly.
Above all, brands need to demonstrate empathy, compassion, and sensitivity. This is a time to think about how your company and its products can genuinely help others in their time of need. The emphasis should be solving problems, not selling products.
This could be about producing products and services that actively help to address current issues, such as Burberry making personal protective equipment for frontline medical practitioners, or LVMH converting its fragrance factories to produce hand sanitiser for French hospitals.
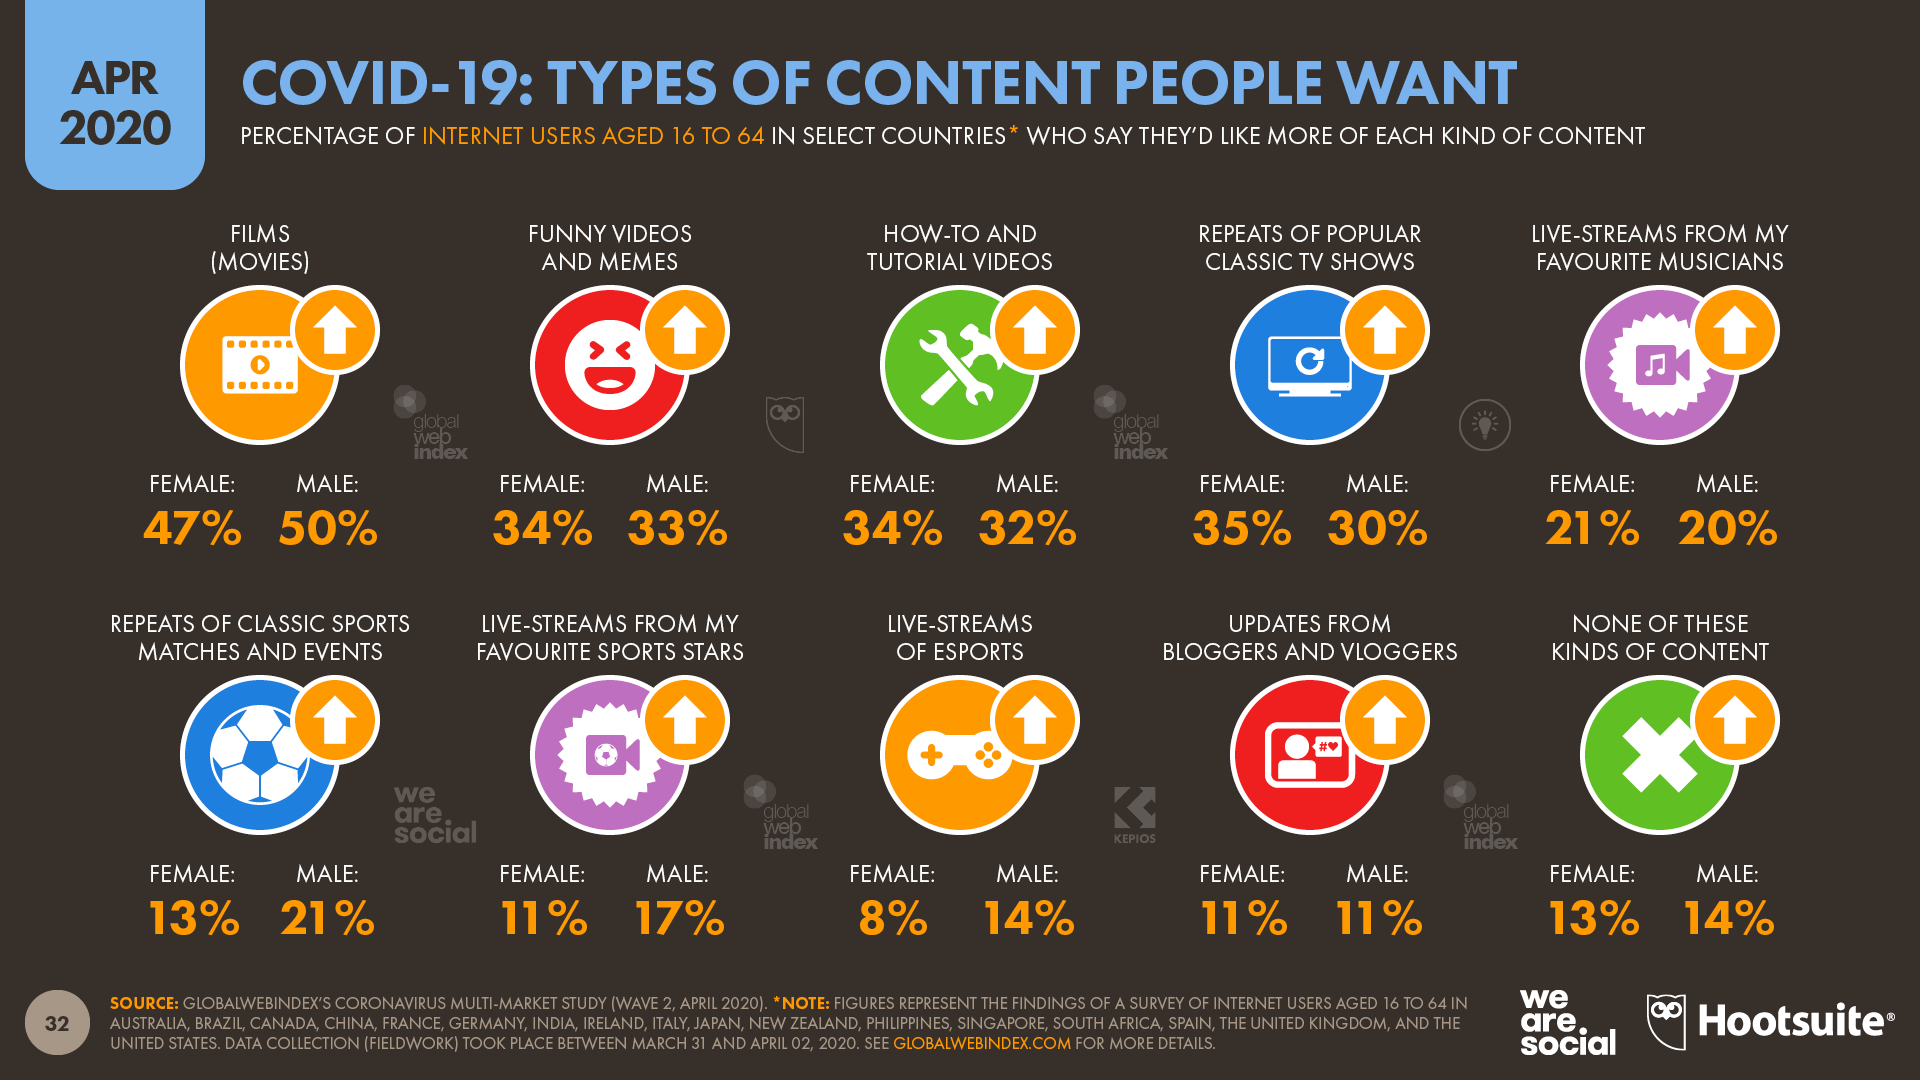
However, something as simple as creating content that helps everyday people to achieve their own objectives can also add meaningful value. Indeed, GlobalWebIndex finds that tutorials and how-to videos are amongst the top kinds of content that consumers want more of during the COVID-19 crisis, and these may represent a particularly compelling opportunity for B2B brands.
However, brands should be very careful when it comes to the use of humour. While GlobalWebIndex finds that people are craving more ‘funny’ content, this finding likely focuses on dedicated entertainment formats such as TV shows, and Edelman finds that 57 percent of consumers think brands should stop marketing activities that might be considered as “humorous or too lighthearted in tone” while the pandemic continues.
Organic social increases too Paid media don’t represent the only opportunities for brands, however, and the latest data offer a selection of good news for marketers who have seen budgets slashed in recent weeks.
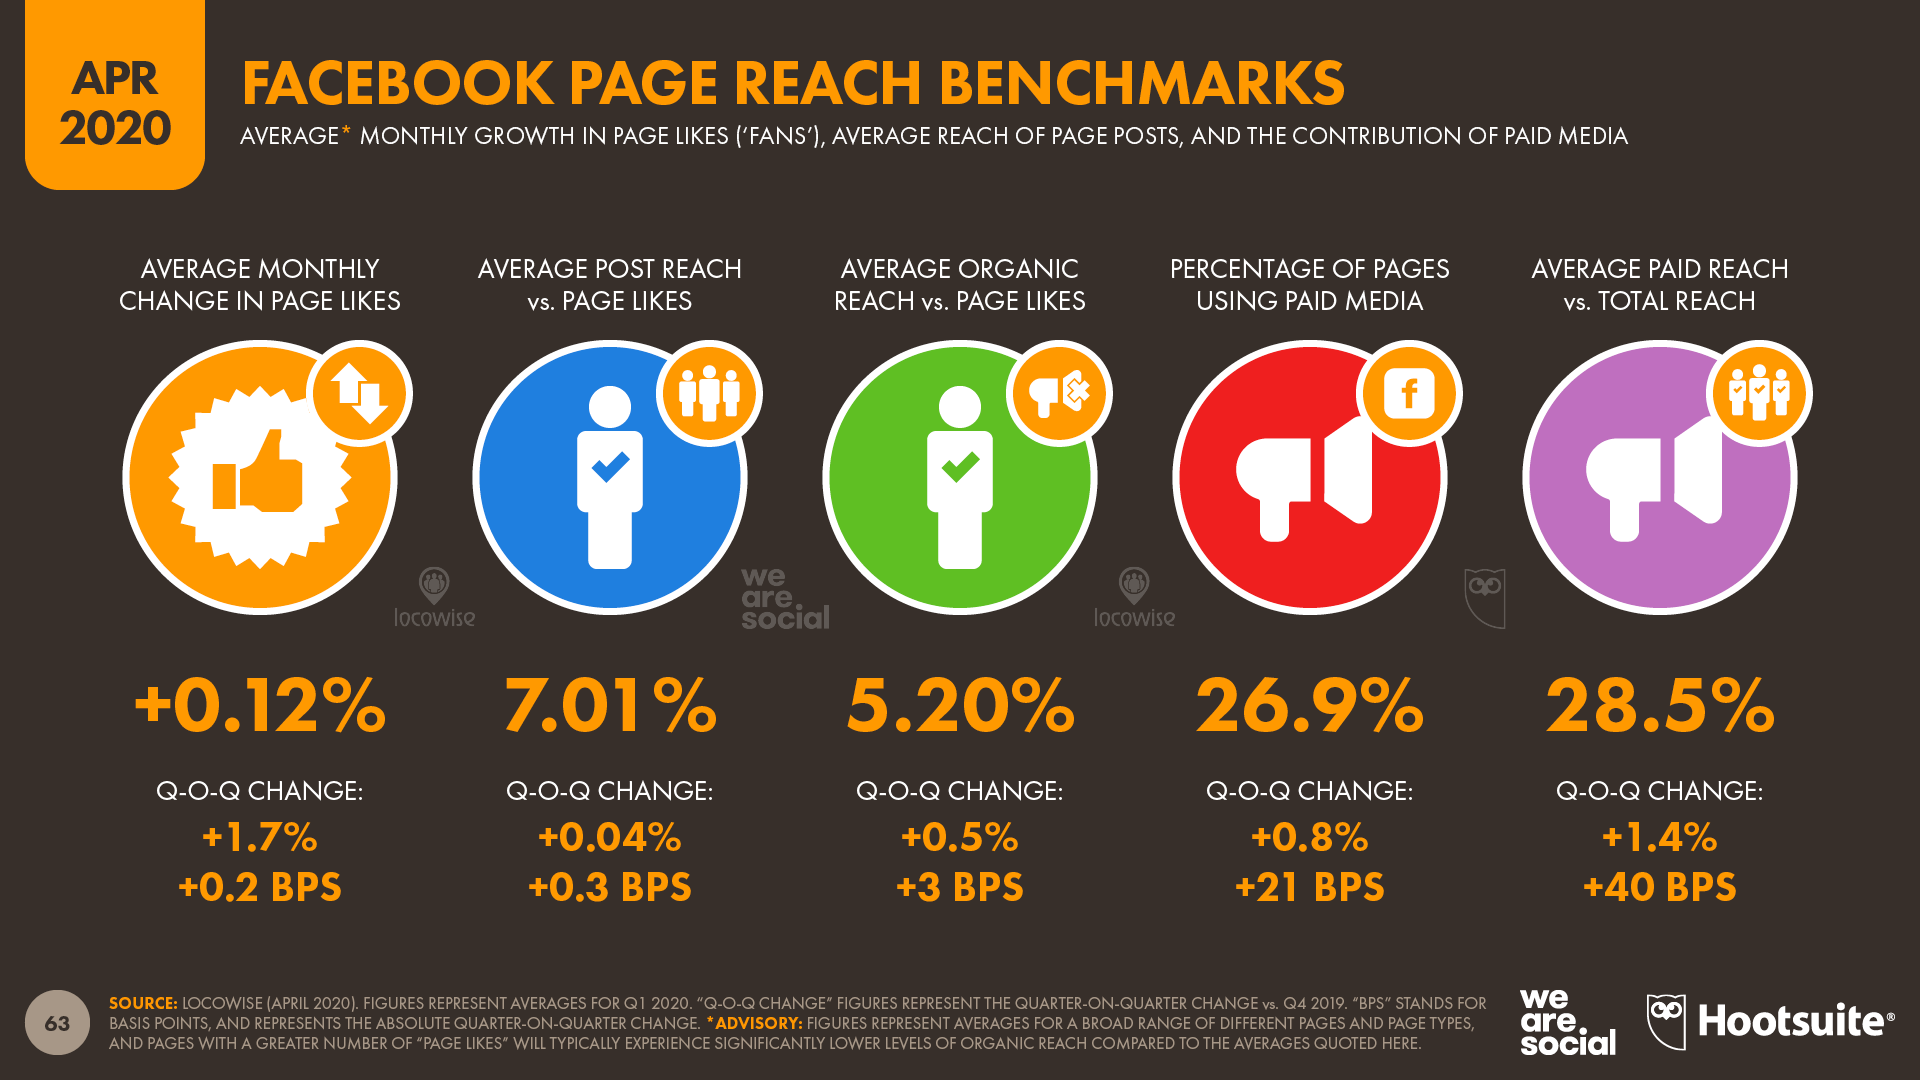
For starters, new numbers from Locowise show that organic reach on Facebook has actually increased over the past 3 months – the first time we’ve seen this metric improve in the time that we’ve been tracking it. The increase was admittedly quite modest (just 0.5 percent), but – as the saying goes – every little helps.
Facebook’s own data also suggests that people have been more active on its core platform in recent weeks. One of the key changes has come in Page Likes, which have remained stubbornly low for most users since the platform’s inception.
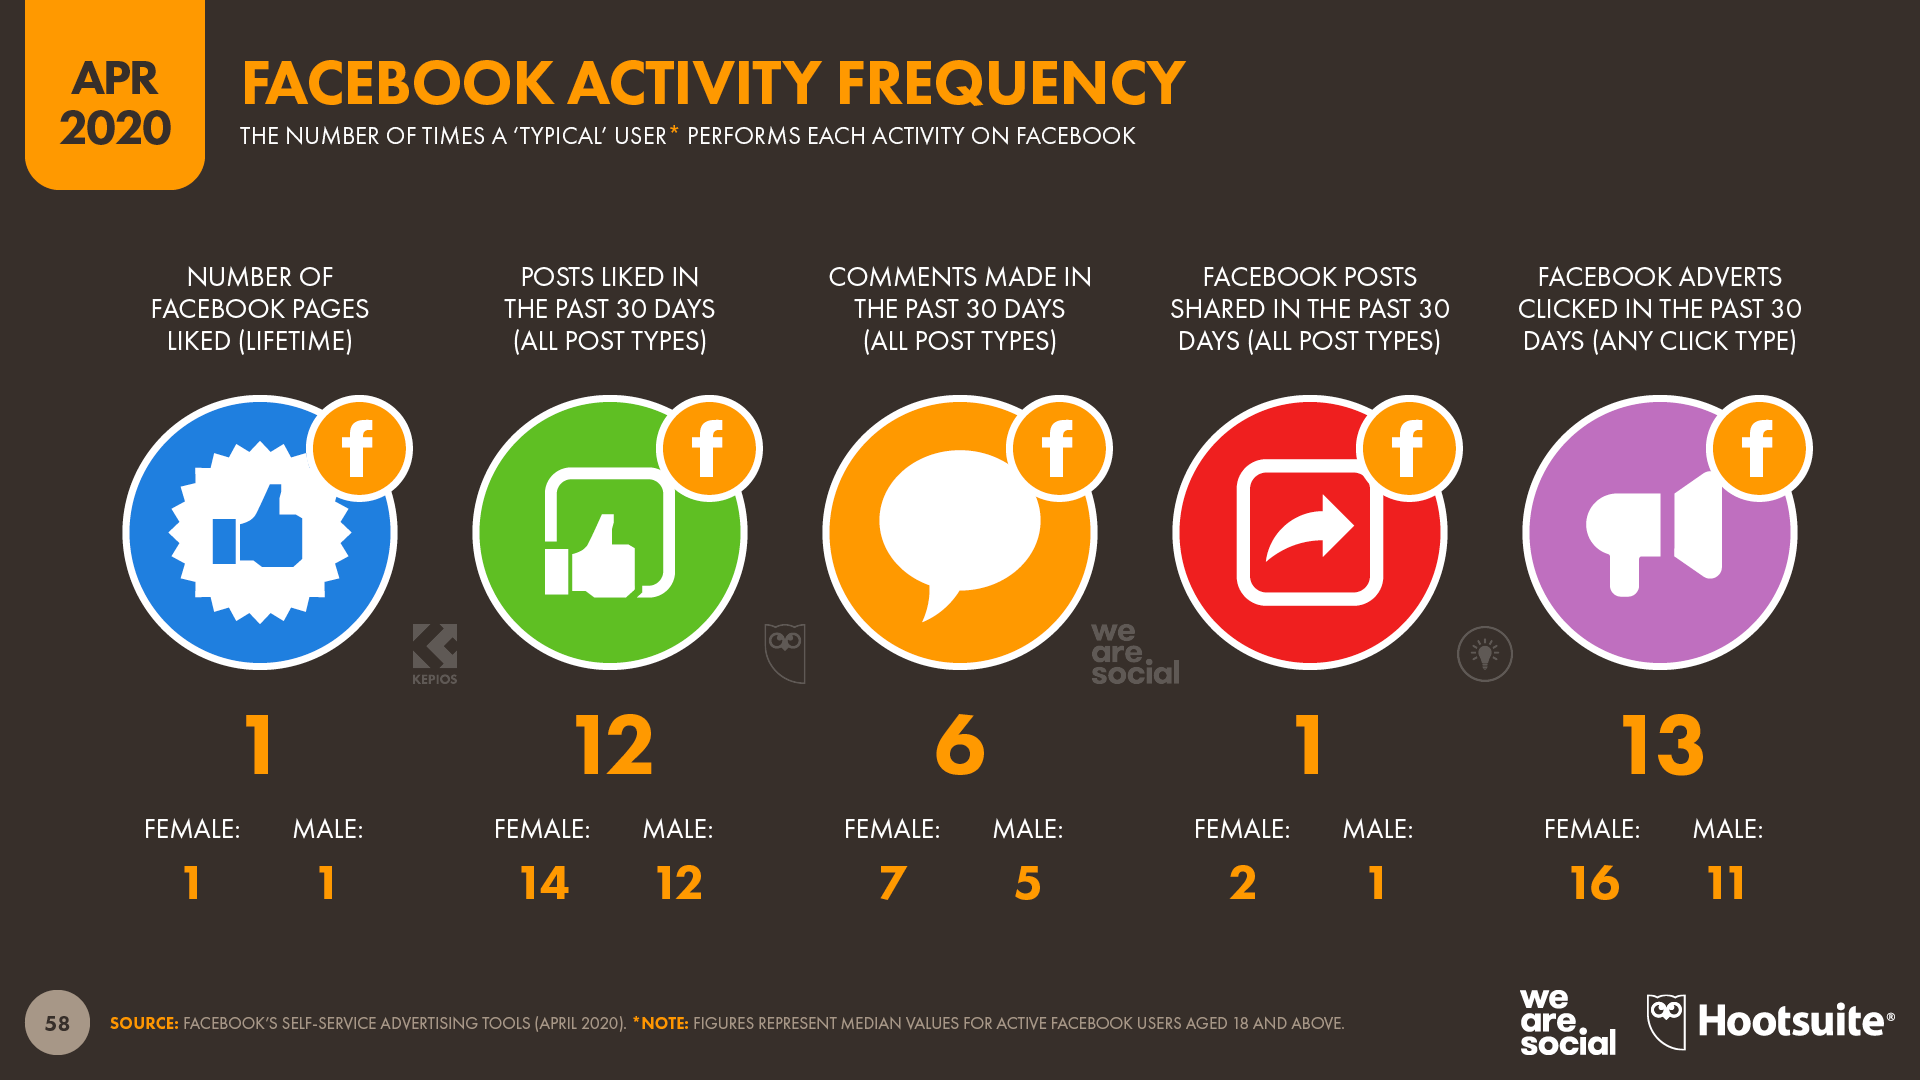
For context, Facebook’s self-service advertising tools have long reported that the typical user around the world has only ever ‘Liked’ one page on Facebook. As you might expect, this median varies from country to country, but no country registers more than 3 median Page Likes per users, and just 10 countries around the world have reached this level [for reference, these countries include Botswana, Tunisia, and Mongolia; you can find the full local story in our individual country reports].
However, data published in these tools over recent weeks have shown a sudden increase in the number of countries in which users have liked a median of 2 or more pages – up from 41 countries in January, to 91 countries today. It’s unclear from the data which kinds of pages have benefited from this increase, but there is a chance that at least some of these pages will be related to the coronavirus pandemic, rather than being brand pages.
Interestingly though, the number of post likes appears to have fallen during the same period, down from a median of 13 post likes per month in December 2019, to a median of 12 per month in March 2020. The picture varies by age and gender though, with women in their 30s and 40s more likely to click ‘like’ compared to users in other groups.
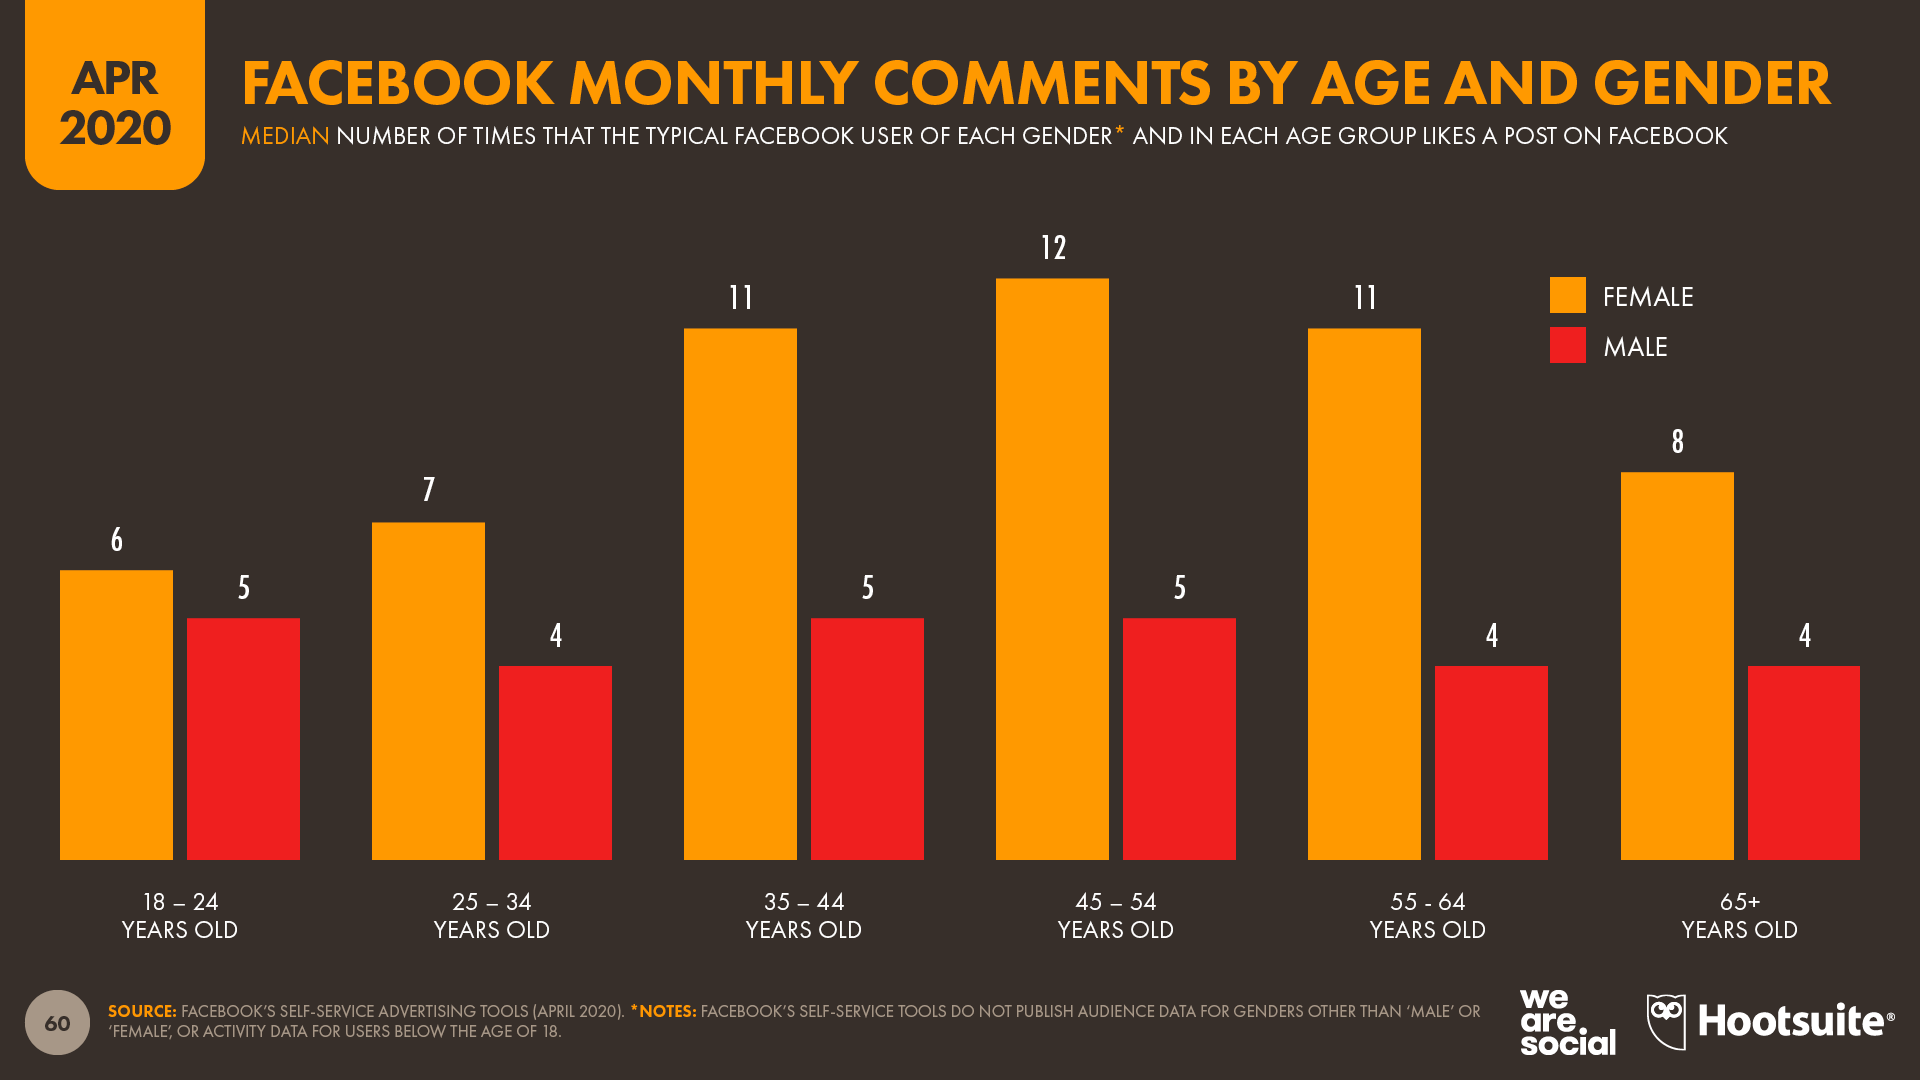
But – in contrast to declining post likes – commenting activity appears to have increased over recent weeks, with Facebook’s tools reporting that the typical global user made a median of 6 comments during March 2020, compared to a median of 5 in December 2019.
Once again, the level of comments varies meaningfully by age and gender, and women between the ages of 35 and 64 are considerably more likely to post a comment than users in any other demographic group.
And while we’re on the subject of organic content, it’s worth noting that email marketing also appears to be enjoying improved performance in recent weeks.
Data from BounceX shows that global email open rates have increased by roughly 30 percent since the start of March, while email click rates have also seen increases of between 5 and 10 percent (albeit with meaningful daily fluctuations).
Marketing mix considerations: social platform overlaps Updates to platform user numbers seem to be a constant source of anxiety for marketers, who worry that they need to jump on every new platform in order to remain relevant.
Admittedly, new platforms can offer a wealth of new opportunities, from exciting content formats, to reduced cost per impression, or even a ‘halo effect’ of being the first to try something new.
However, if reach is one of your key considerations, the chart below should help you to make some more informed decisions when it comes to your channel mix, by helping you to identify what proportion of each social media platform’s users are ‘unique’.
First, a bit of guidance on how to read the chart. The percentages in the table identify the share of users of each platform in the left-hand column that are also users of each platform in the top row.
For example, 35 percent of Instagram users also use Snapchat, while 86 percent of Snapchat users also use Instagram [note that this disparity is partly due to the fact that Instagram has roughly 3 times as many total users as Snapchat].
But what does this great data from GlobalWebIndex actually tell us?
The key takeaway is that very few social media users are ‘unique’ to just one platform. Being the largest platforms, Facebook and YouTube have the largest unique audiences, but even these platforms’ unique audiences only represent 6 percent and 7 percent (respectively) of their total user bases.
More importantly, just 1 percent of the users of TikTok and Snapchat say they don’t use any other social platforms. Critically, this means that marketers can reach 99 percent of these platforms’ users via other social channels.
Reach isn’t the only consideration when it comes to channel choices of course, but if big headlines about growing user bases have made you question whether you’ve adopted the right channel mix, these figures should help to allay many of your fears.
My advice: fewer, bigger, better is still the simplest path to success when it comes to a social platform portfolio. Trying to manage presences on multiple platforms will likely stretch your resources, and you’ll quickly reach diminishing returns – especially if you’re not creating unique content for each platform.
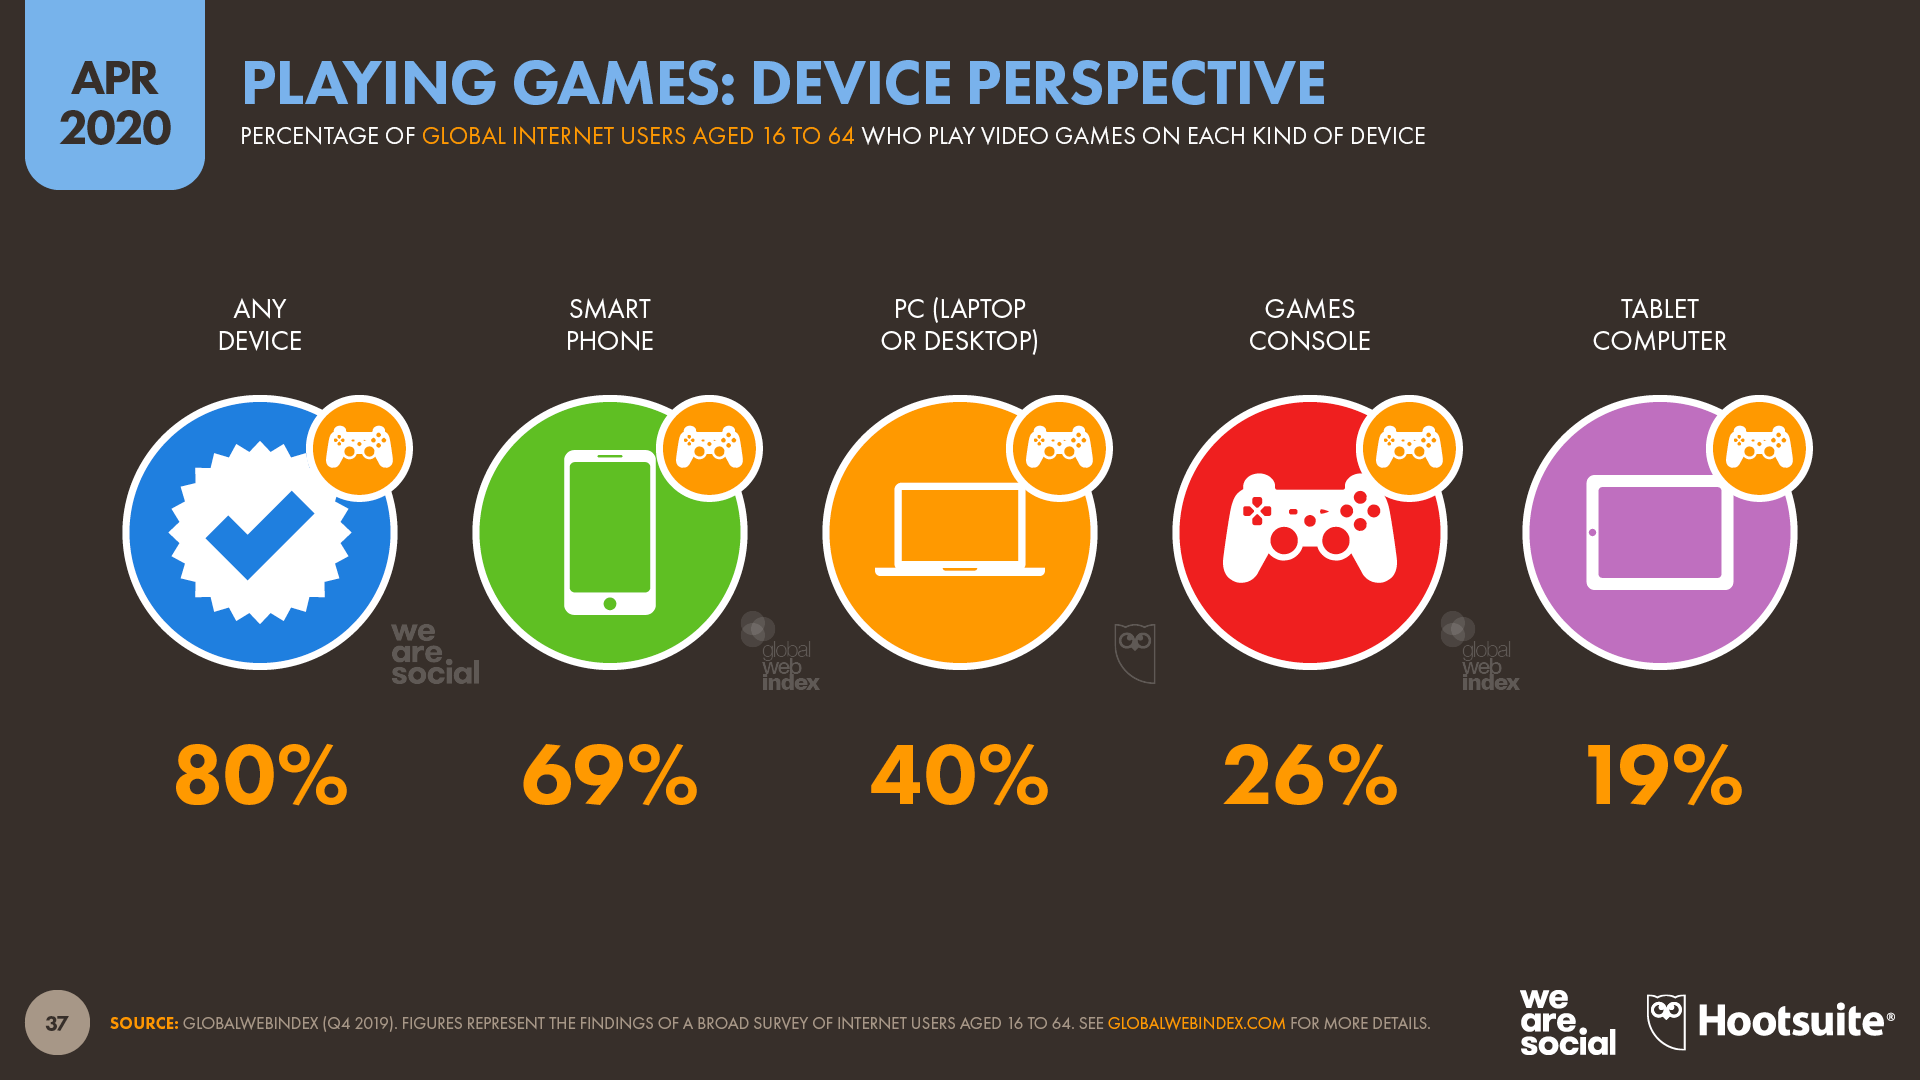
Games are a top choice for a world on lockdown Video games have been a popular choice amongst people confined to their homes during the coronavirus pandemic. Data from GlobalWebIndex shows that – even before the current wave of lockdowns – 4 in 5 of the world’s internet users already played video games.
However, new data from App Annie shows that weekly downloads of mobile games in March 2020 jumped by 30 percent compared to weekly averages for the final quarter of 2019, with people around the world downloading more than a billion games each week.
In total, mobile users downloaded more than 13 billion games during the first three months of this year, and spent close to US$17 billion dollars on mobile games and in-game purchases during the same period – a 5 percent increase on spends in the last three months of 2019.
GlobalWebIndex also finds that more than a third of internet users between the ages of 16 and 64 have been spending more time playing video games in recent weeks. This trend is particularly evident amongst younger users, with 43 percent of male internet users aged 16 to 24 saying they’re spending more time gaming.
These evolving behaviours are visible in other kinds of data too. AT&T reports that gaming-related traffic in April 2020 was 50 percent higher than pre-lockdown levels.
We’re not just spending more time playing games either; GlobalWebIndex’s research also finds that 10 percent of internet users around the world have been spending more time watching esports.
Critically, however, this figure rises to more than 20 percent for internet users in India, which could point to a huge opportunity in one of the world’s biggest internet markets if this increased interest in esports continues in a post-lockdown world.
Mobile’s growing influence The latest data from GlobalWebIndex show that mobile’s share of total internet time increased again in Q4 2019, and mobile devices now account for more than 51 percent of our connected lives. However, this data was collected prior to the current coronavirus outbreak, and the company’s more recent (unpublished) data indicate that people’s habits under lockdown will serve to extend mobile’s lead even further.
This finding is supported by data from App Annie, which shows that the amount of time people spent using mobile devices during the first three months of 2020 increased by 20 percent compared to the same period last year.
The company also reports that in China – the first country to impose a mass lockdown to contain the spread of coronavirus – mobile users spent an average of 5 hours per day using apps across the first three months of 2020, representing an increase of 30 percent compared to the levels seen at the start of 2019. Italy saw a similar pattern, with users spending more than 10 percent more time in apps across the whole of the first quarter.
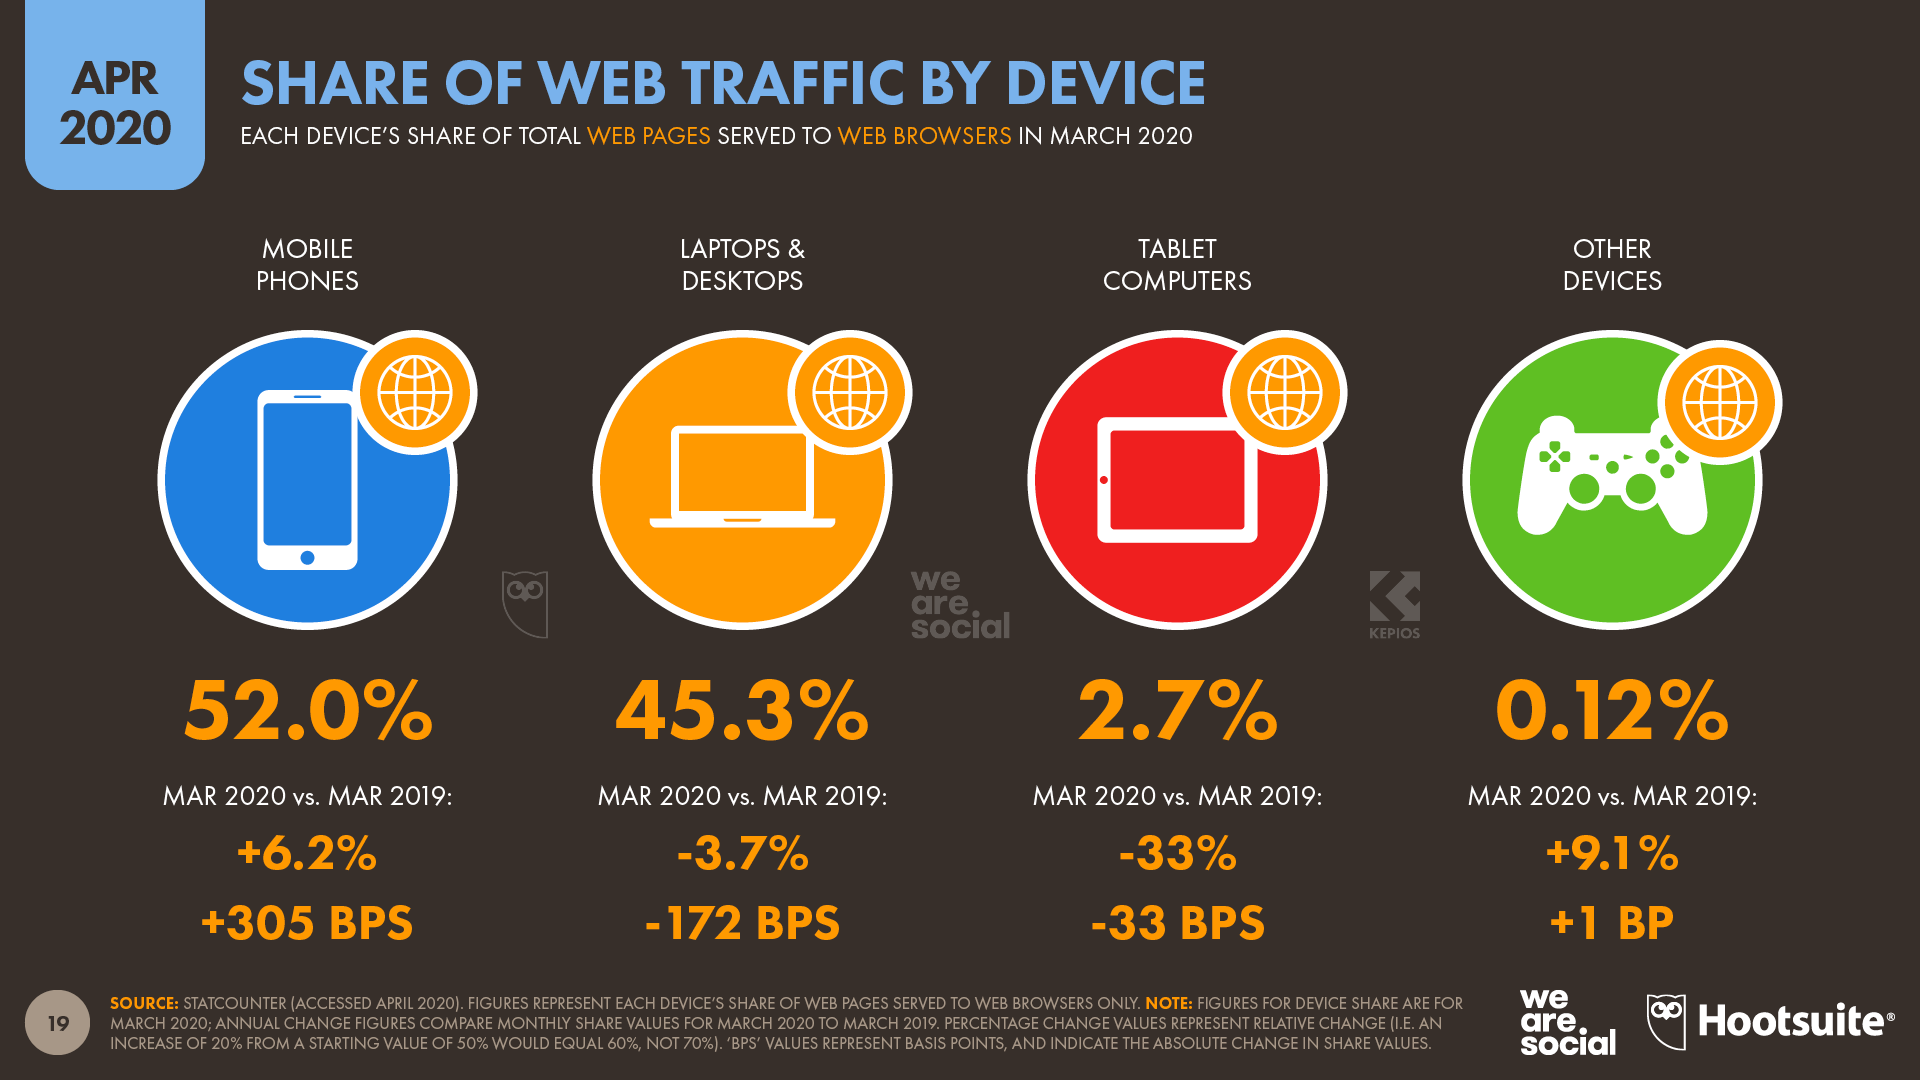
Meanwhile, data from Statcounter shows that mobile devices accounted for a greater share of global web traffic in March 2020 compared to the same time last year. The company’s latest data reveal that 52 percent of web page requests in March 2020 originated from mobile devices, representing a relative increase of more than 6 percent compared to the 48.9 percent that the company reported in March 2019.
Computers’ share of web traffic dropped from 47 percent in March 2019 to 45.3 percent in March 2020, representing a relative drop of almost 4 percent, while tablets’ share of total traffic dropped by a third, from 4 percent in March 2019 to 2.7 percent in March 2020.
These latest global figures are comparable with each device’s relative share throughout the second half of 2019 though, and early lockdown measures don’t appear to have had a dramatic impact on device preferences when it comes to the world’s web browsing activities.
However, this may be because many countries only started lockdowns towards the end of March, so there’s a chance that the data for April will tell a different story. For example, Spain and South Korea – which both started lockdowns earlier in March – have seen a significant uptick in web traffic from laptops and desktops over recent weeks.
Another interesting trend in mobile has been a marked increase in web traffic associated with iPhone devices. Data from Statcounter show that handsets powered by Apple’s iOS have steadily been gaining web traffic share over the past 6 months, up from 22 percent in October 2019, to 27 percent in March 2020.
During the same period, the traffic shares attributable to handsets running operating systems other than Android or iOS have fallen considerably, highlighting the ongoing consolidation in the industry.
However, it’s worth noting that people have also been spending more time using laptops and desktops as they find ways of dealing with life under lockdown, and people haven’t suddenly abandoned their computers.
My sense is that we’ll also see device shares return to levels similar to those we saw before the pandemic once people are able to return to something resembling normal life.
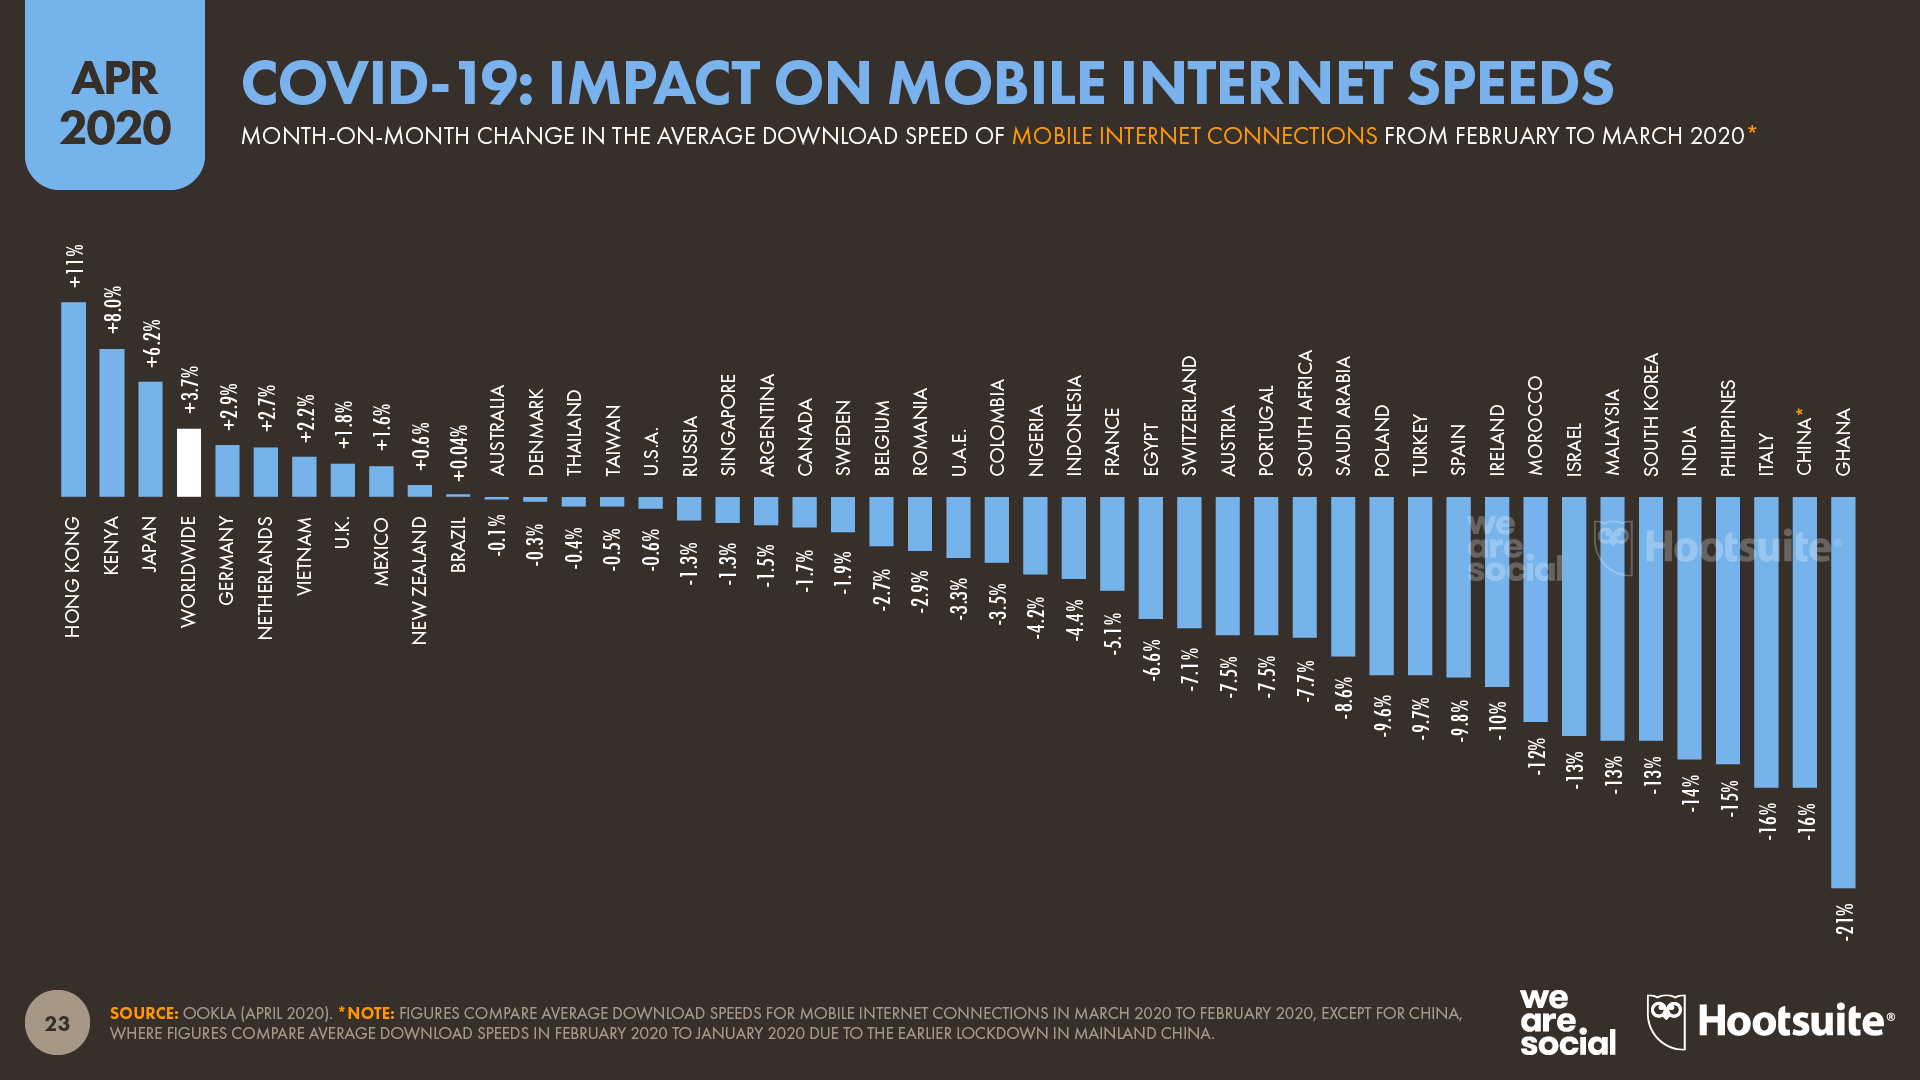
Internet speeds slow due to increased demand COVID-19 lockdowns have also had a clear impact on internet connection speeds. The latest data from Ookla shows that many countries saw meaningful drops in average download speeds for both mobile and fixed internet connections between February and March 2020.
However, most countries still registered year-on-year increases in average connection speeds, so it’s likely that these month-on-month drops are a direct result of the increased network demands of people’s lockdown-specific behaviours.
For example, the sudden increase in video streaming – both for video conferencing apps like Zoom, and content streaming services like Netflix – will have resulted in a significant increase in demand for bandwidth, and given the unexpected nature of these increases, it’s little surprise that networks have been affected.
However, some of the larger streaming platforms have taken active measures to reduce the load that their services impose on networks, with Netflix being one of the first to publicly announce temporary reductions in streaming rates in order to reduce bandwidth demands.
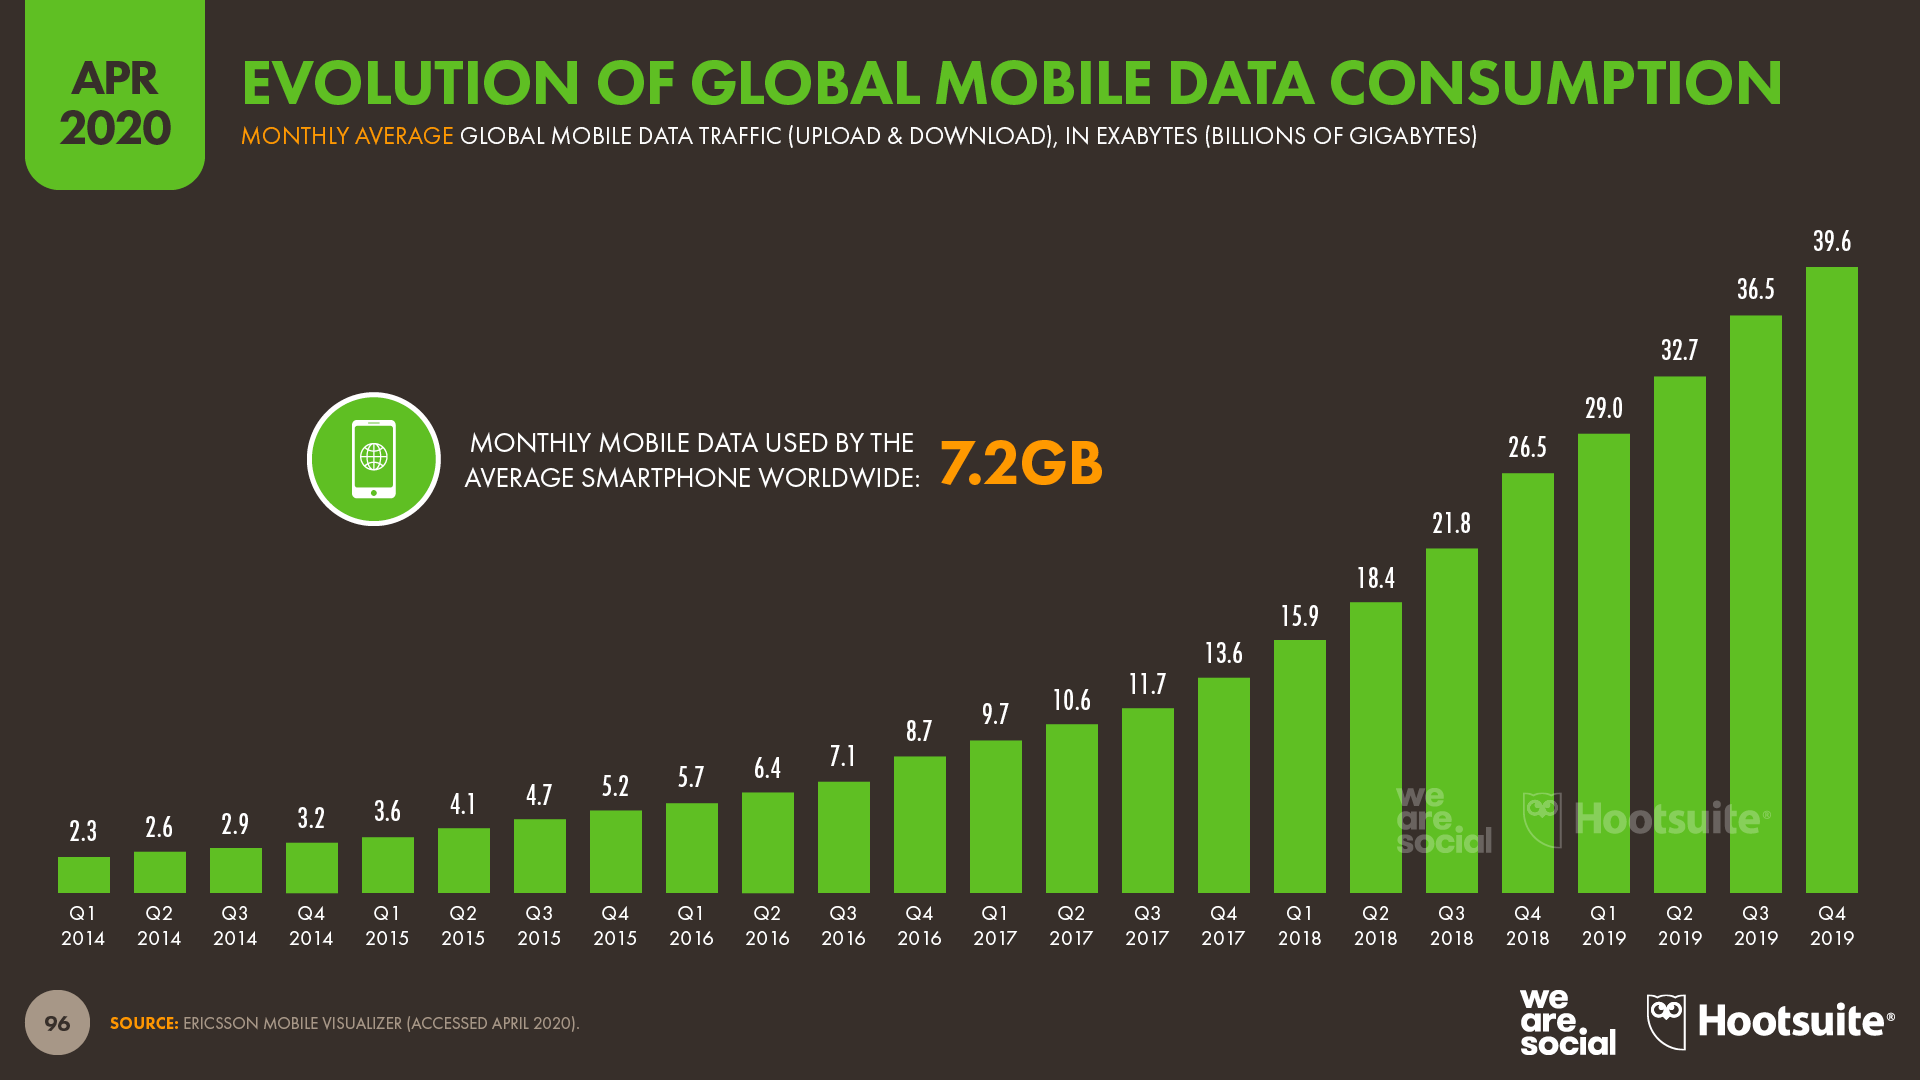
The latest data from Ericsson show that the world’s mobile users already consumed almost 40 billion gigabytes of mobile data every month during Q4 2019, but all the evidence suggests that this figure will jump considerably in Q1 2020.
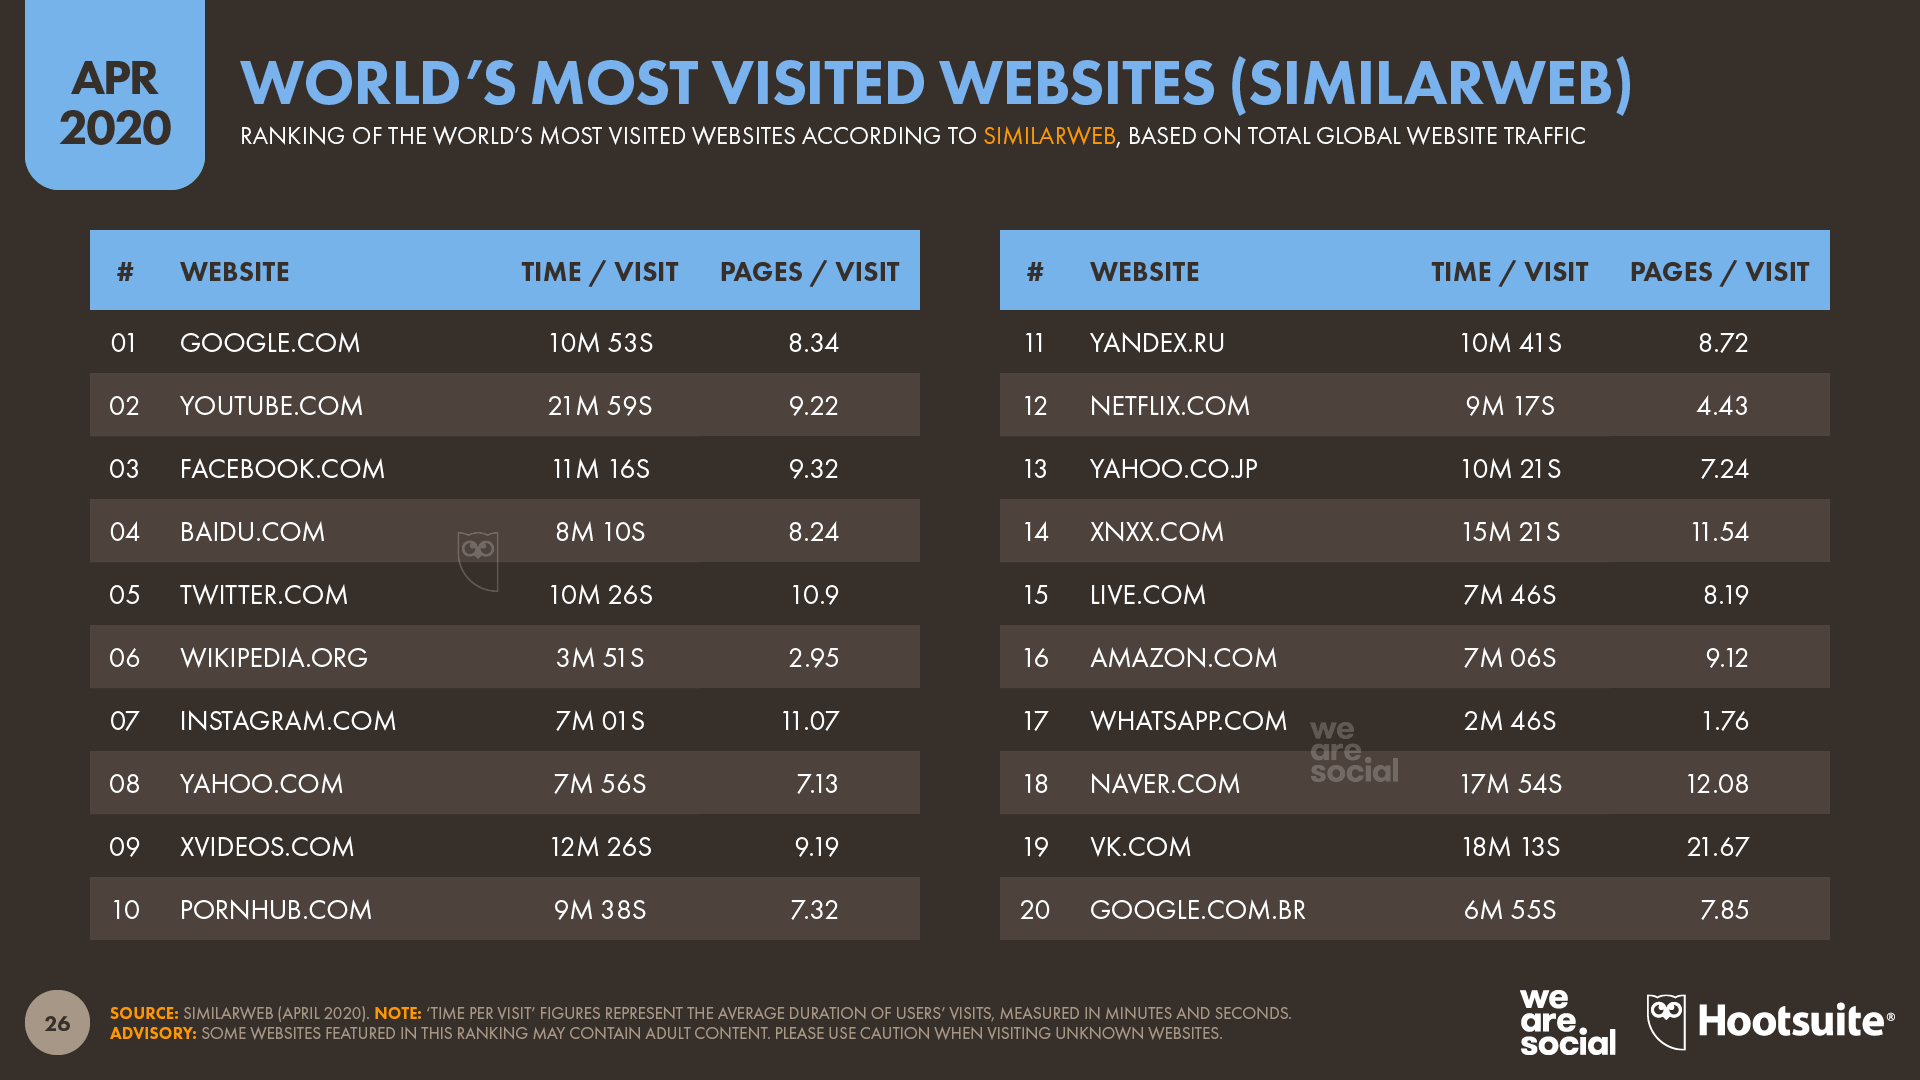
However – despite a slew of lurid headlines – it doesn’t appear that adult content has contributed to increased bandwidth consumption, at least at a global level. The latest data from SimilarWeb suggest that there hasn’t been a significant change in traffic to the world’s most popular adult content websites in recent weeks, nor have visitors been spending any longer on these sites than they did prior to coronavirus lockdowns.
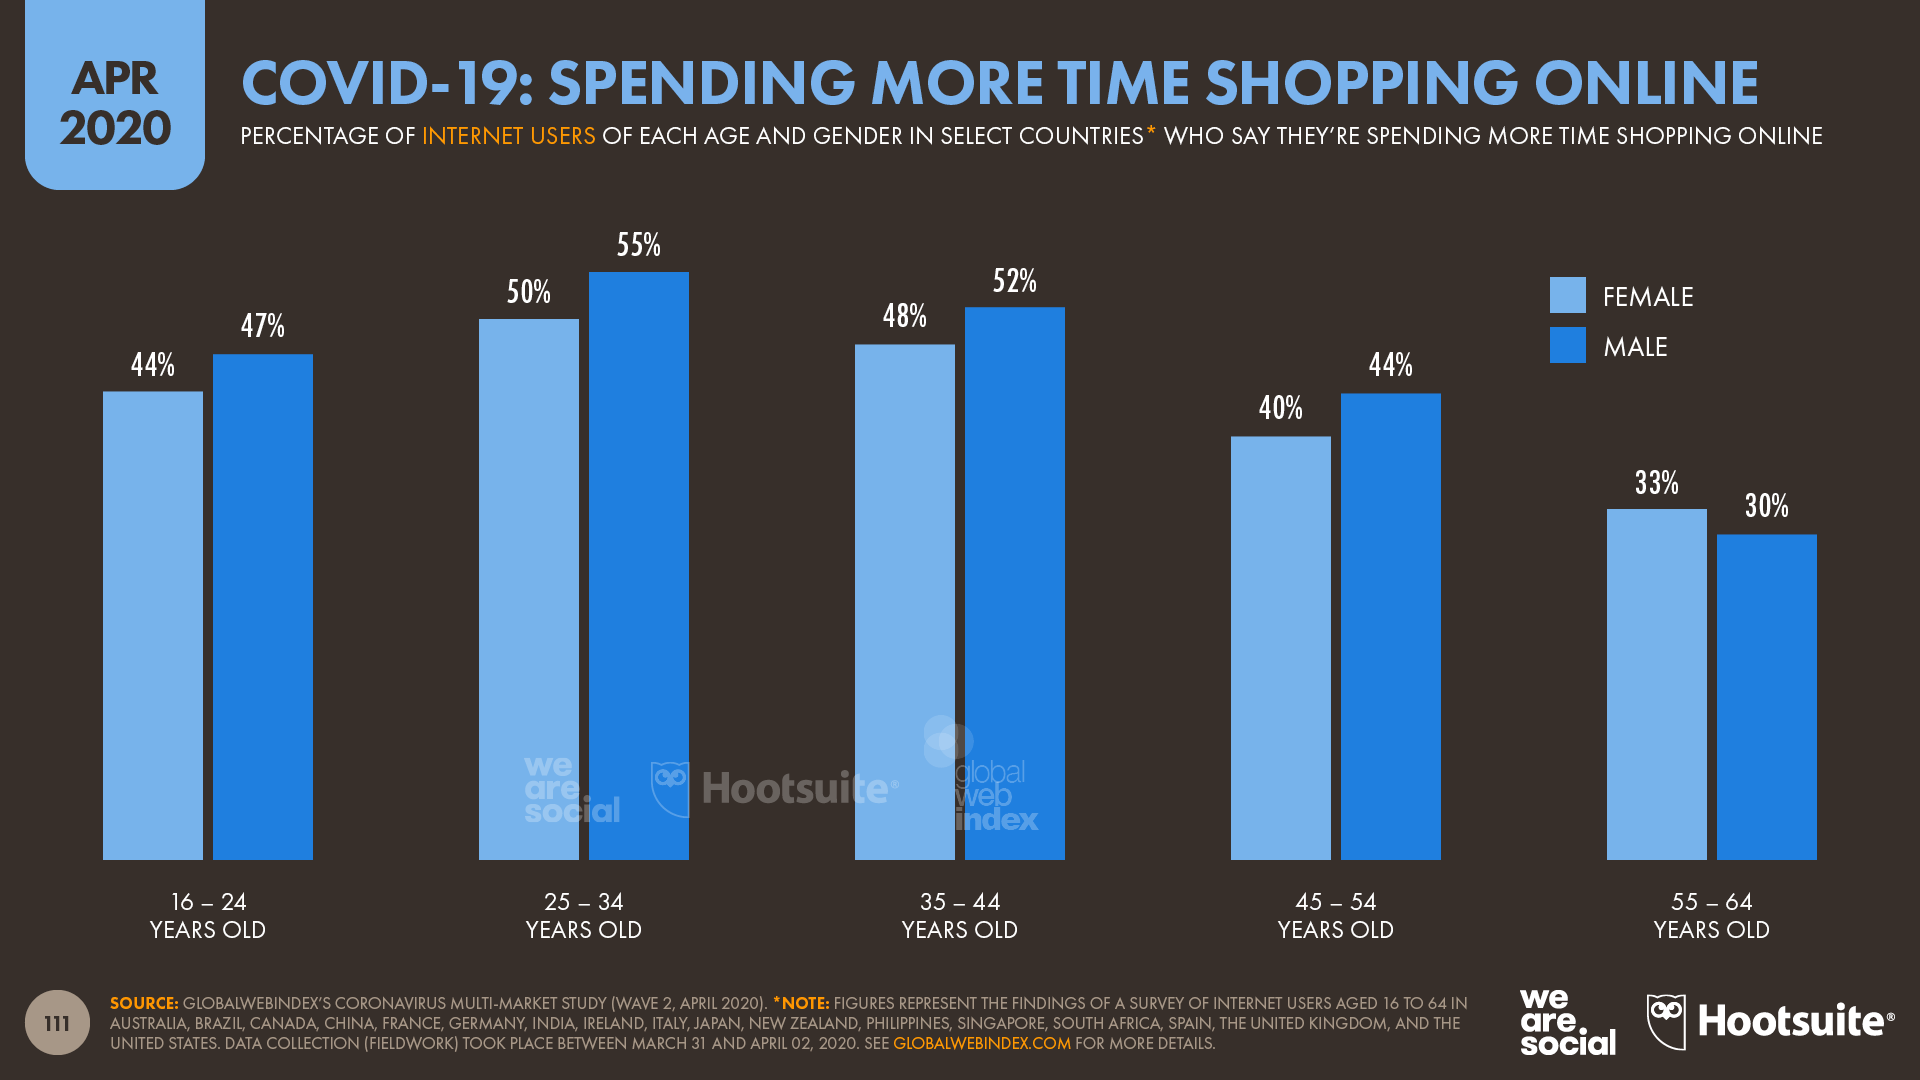
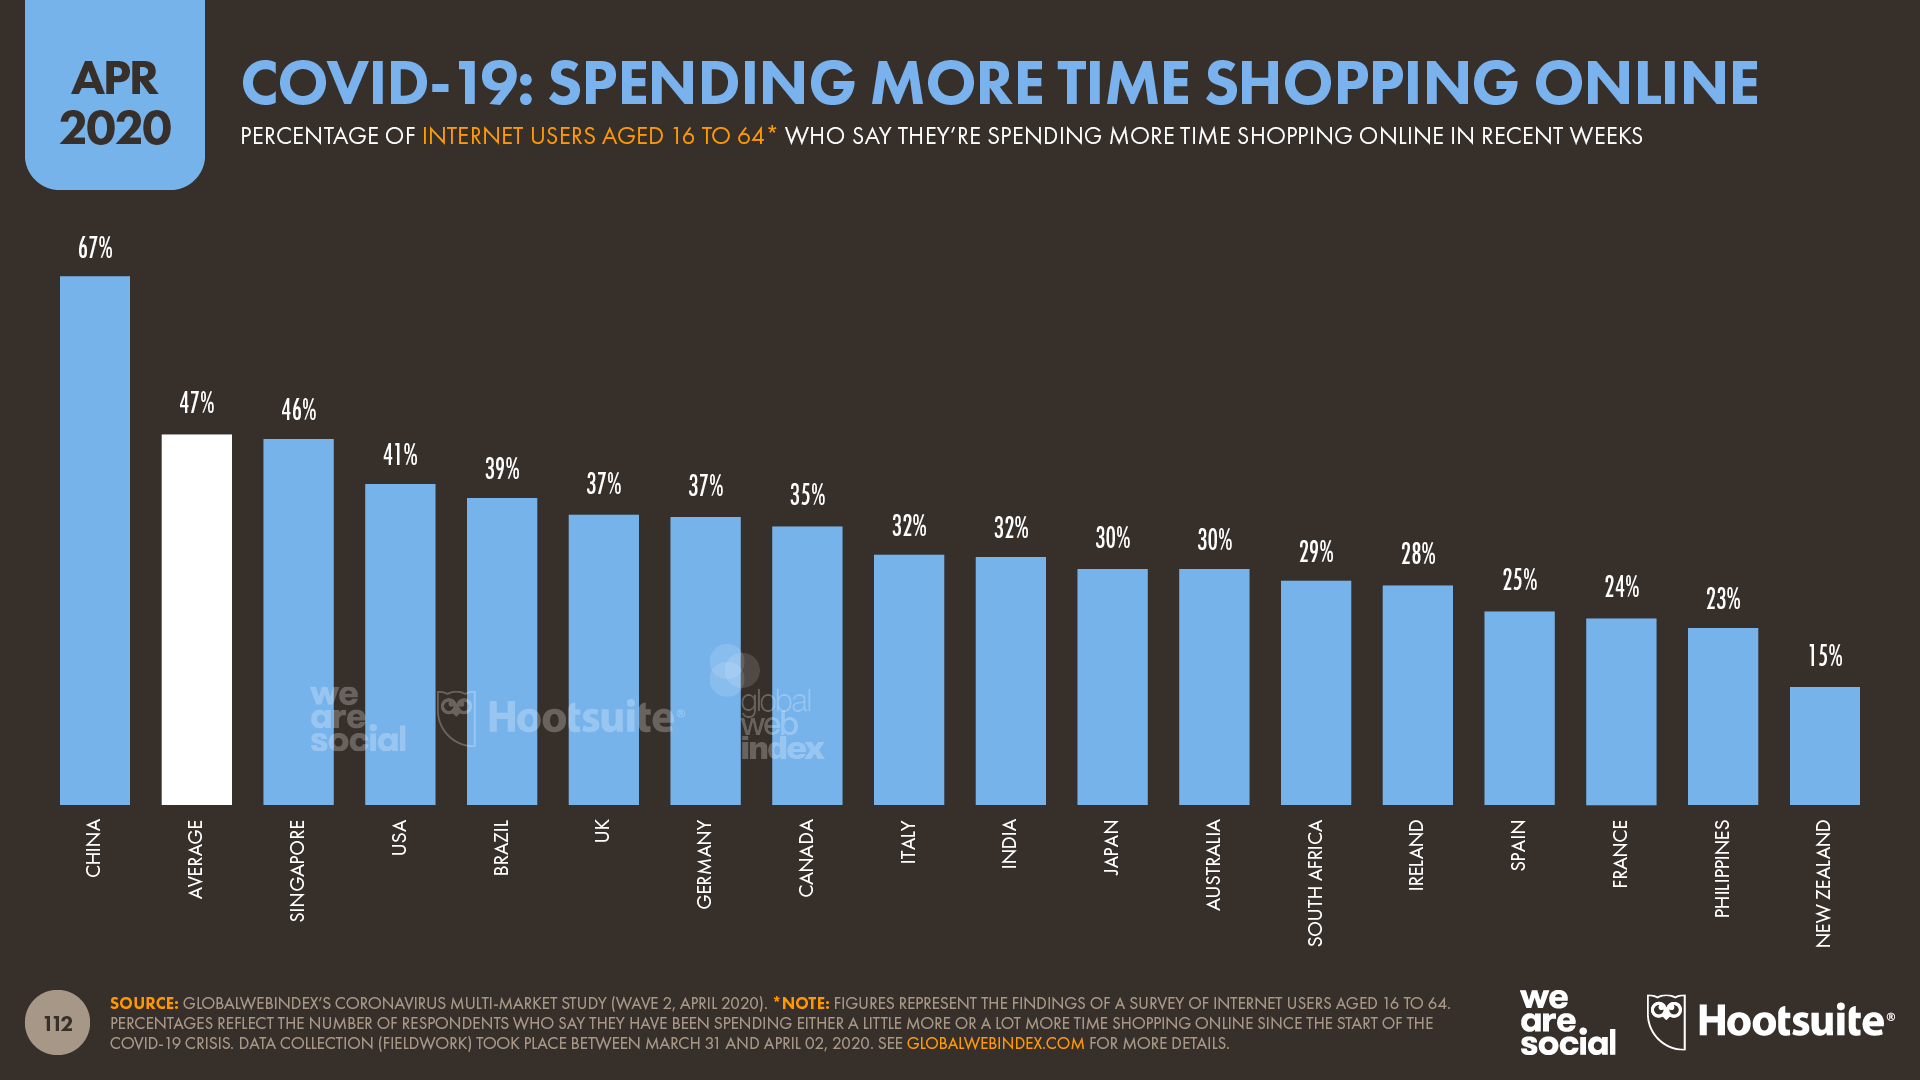
The world turns to ecommerce during lockdowns Nearly half of the internet users surveyed by GlobalWebIndex at the start of April said that they’ve been spending more time shopping online in recent weeks, but there are some interesting differences between the behaviours of different genders and age groups.
More than half of internet users aged 25 to 44 in the 17 countries covered in the survey say they have been spending more time shopping online in recent weeks, with men in particular saying that they’ve increased the amount of time they’re spending on ecommerce activities.
At a country level, China has seen the greatest increase in the amount of time that people have been spending shopping online, which is all the more impressive when we consider that China already has some of the highest rates of ecommerce adoption in the world.
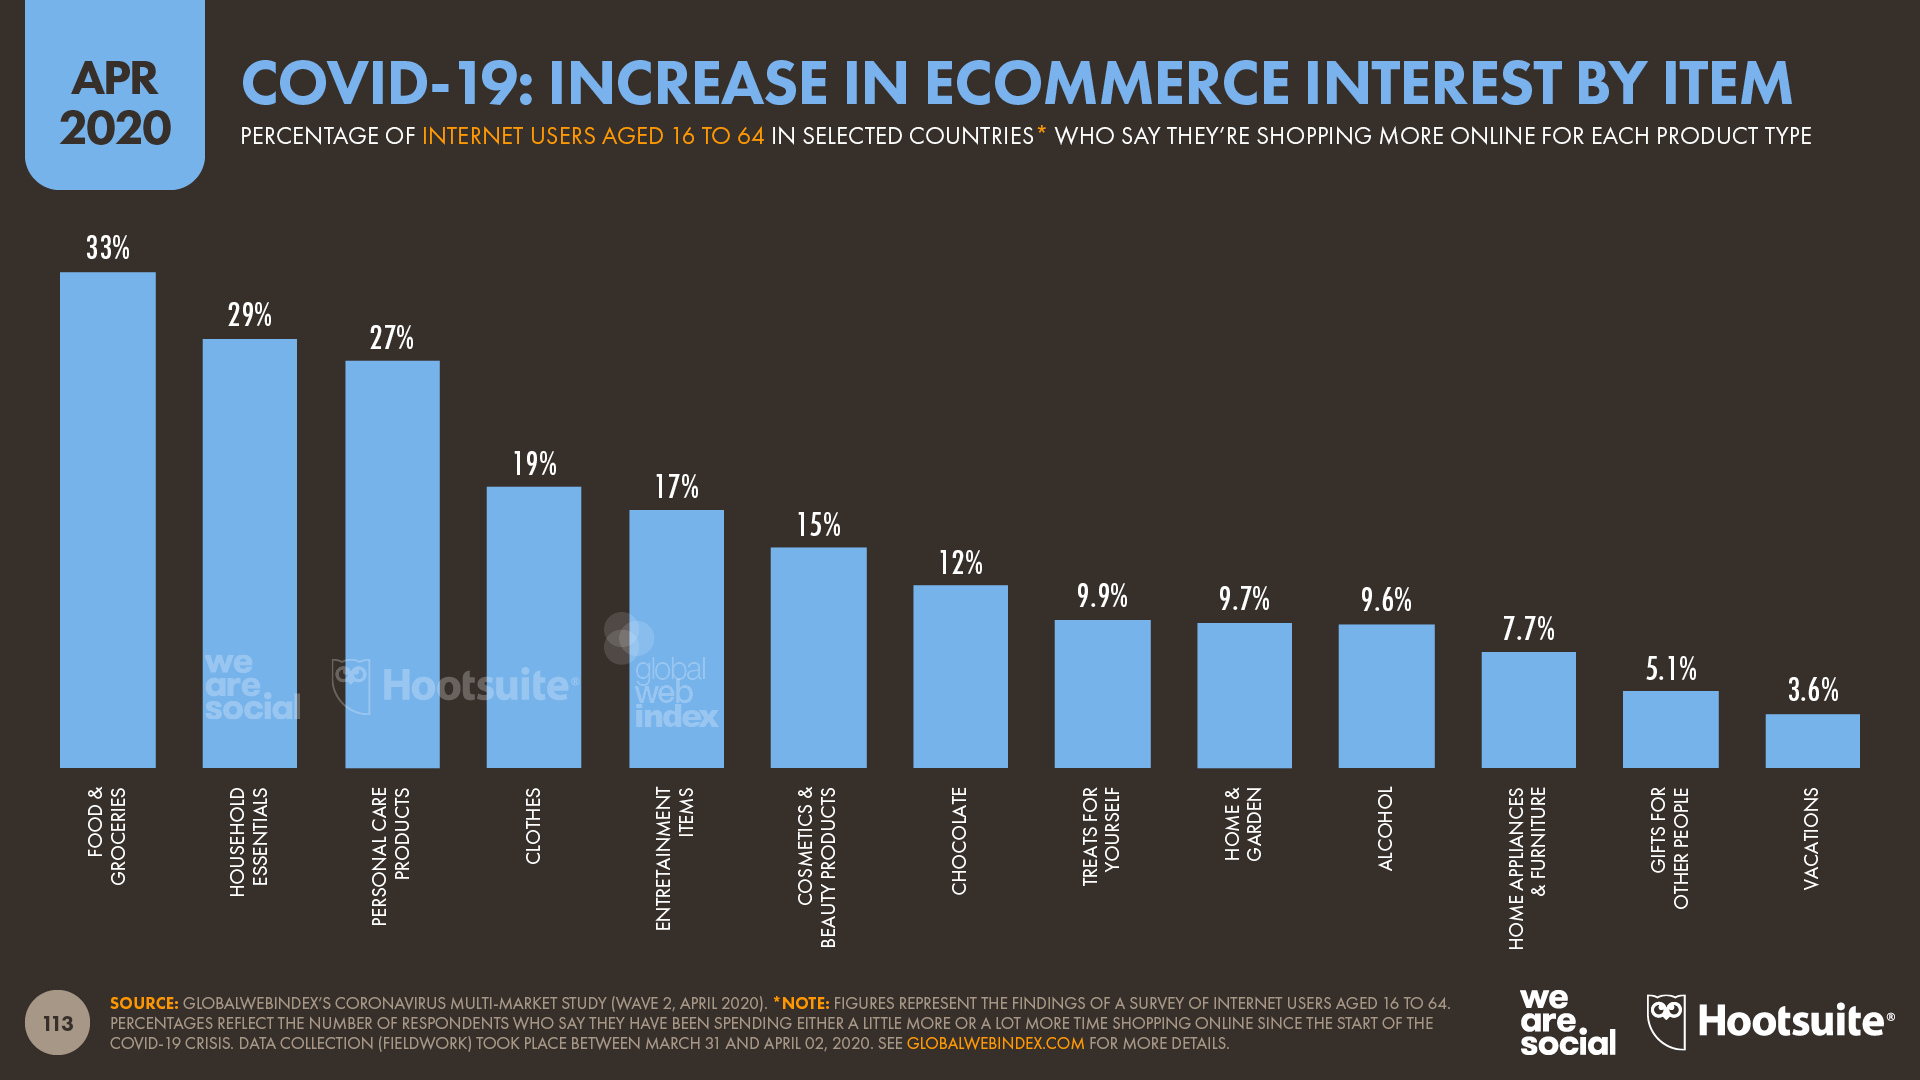
The Food & Grocery category has seen the greatest increases in ecommerce interest, with GlobalWebIndex finding that a third of internet users have been shopping more for these items online as a result of their country’s COVID-19 lockdowns.
This has translated into a significant increase in traffic to supermarket websites too. ContentSquare reported a 251 percent increase in visits to supermarket websites in the seven days from April 8th to April 15th, compared to average weekly traffic at the start of 2020. The company also reported a 76 percent rise in transactions on supermarket websites during the same period, compared to pre-lockdown levels.
These findings are echoed by Alexa’s latest ranking of the world’s top websites, which shows that ecommerce websites currently account for 6 out of the top 20 places. Interestingly, 5 of these are Chinese ecommerce sites, with Alibaba’s Tmall accounting for two distinct domains in the top 10.
While this is perhaps unsurprising given the extent of China’s coronavirus lockdown, it suggests that the shift in the internet’s centre of gravity that we covered in our October 2019 and January 2020 reports continues, and that trend may even be accelerating.
Sadly, a very different story has been unfolding in the travel category. ContentSquare reports that traffic to tourism-related websites is down by 72 percent in recent weeks compared to pre-COVID levels. Worse still, the company reports that transactions on tourism-related websites have almost completely dried up, registering a 92 percent drop in the week to April 15th compared to the weekly average at the start of 2020.
However, despite these grim statistics, GlobalWebIndex’s research offers a small ray of hope: some people have been using their lockdown time to explore and plan vacations – albeit ones to take in the future.
As a result, travel marketers who have any remaining marketing budget may want to shift their focus from the usual short-term focus of direct-response advertising, to activities designed for longer-term inspiration and branding.
Key considerations here will be platforms like Instagram and Pinterest, which travellers often turn to when they’re in the ‘dreaming’ phase of planning. A return to normality may still seem like a dream for travel brands, but where resources permit, now is an ideal time to start planting seeds for the future.
It will also be interesting to see how many of these ecommerce trends will continue in the post-COVID world. While it’s almost certain that people will return to physical stores once the current phase of lockdowns comes to an end, there’s also a good chance that some of our new behaviours will endure.
In particular, in countries that experience lockdowns lasting longer than a month, there’s a real chance that new behaviours will start to become actual habits. Research suggests that it takes roughly two months for a new behaviour to become an ‘automatic’ habit, although the frequency of action is also an important consideration. As a result, regular activities such as grocery shopping are more likely to see enduring changes in behaviour, compared to categories that have enjoyed a spike in one-off purchases over recent weeks.
Consumers also seem open to continuing with some of their new habits. Research from Kantar found that 42 percent of people in China who started shopping online for the first time during the country’s recent lockdown expected to continue with a combination of online and offline shopping once the lockdown had been lifted.
What the world has been searching for on lockdown Perhaps unsurprisingly, Google has seen a huge increase in coronavirus-related searches in recent weeks. “Coronavirus” was the third most frequently entered search query across the whole of Q1, but the query topped the rankings in March, generating more than twice as many searches as the perennial top term, “Google.”
[For context, “Google” is usually the top search query because people type the word into the address bar of their browser, but then fail to complete the URL with the subsequent “.com”, so when they hit enter, Google treats the word as a search term instead of as a web address].
Meanwhile, searches for “corona” placed third in March’s top search rankings – ahead of Facebook – while a total of four coronavirus-related queries appeared in the top 20.
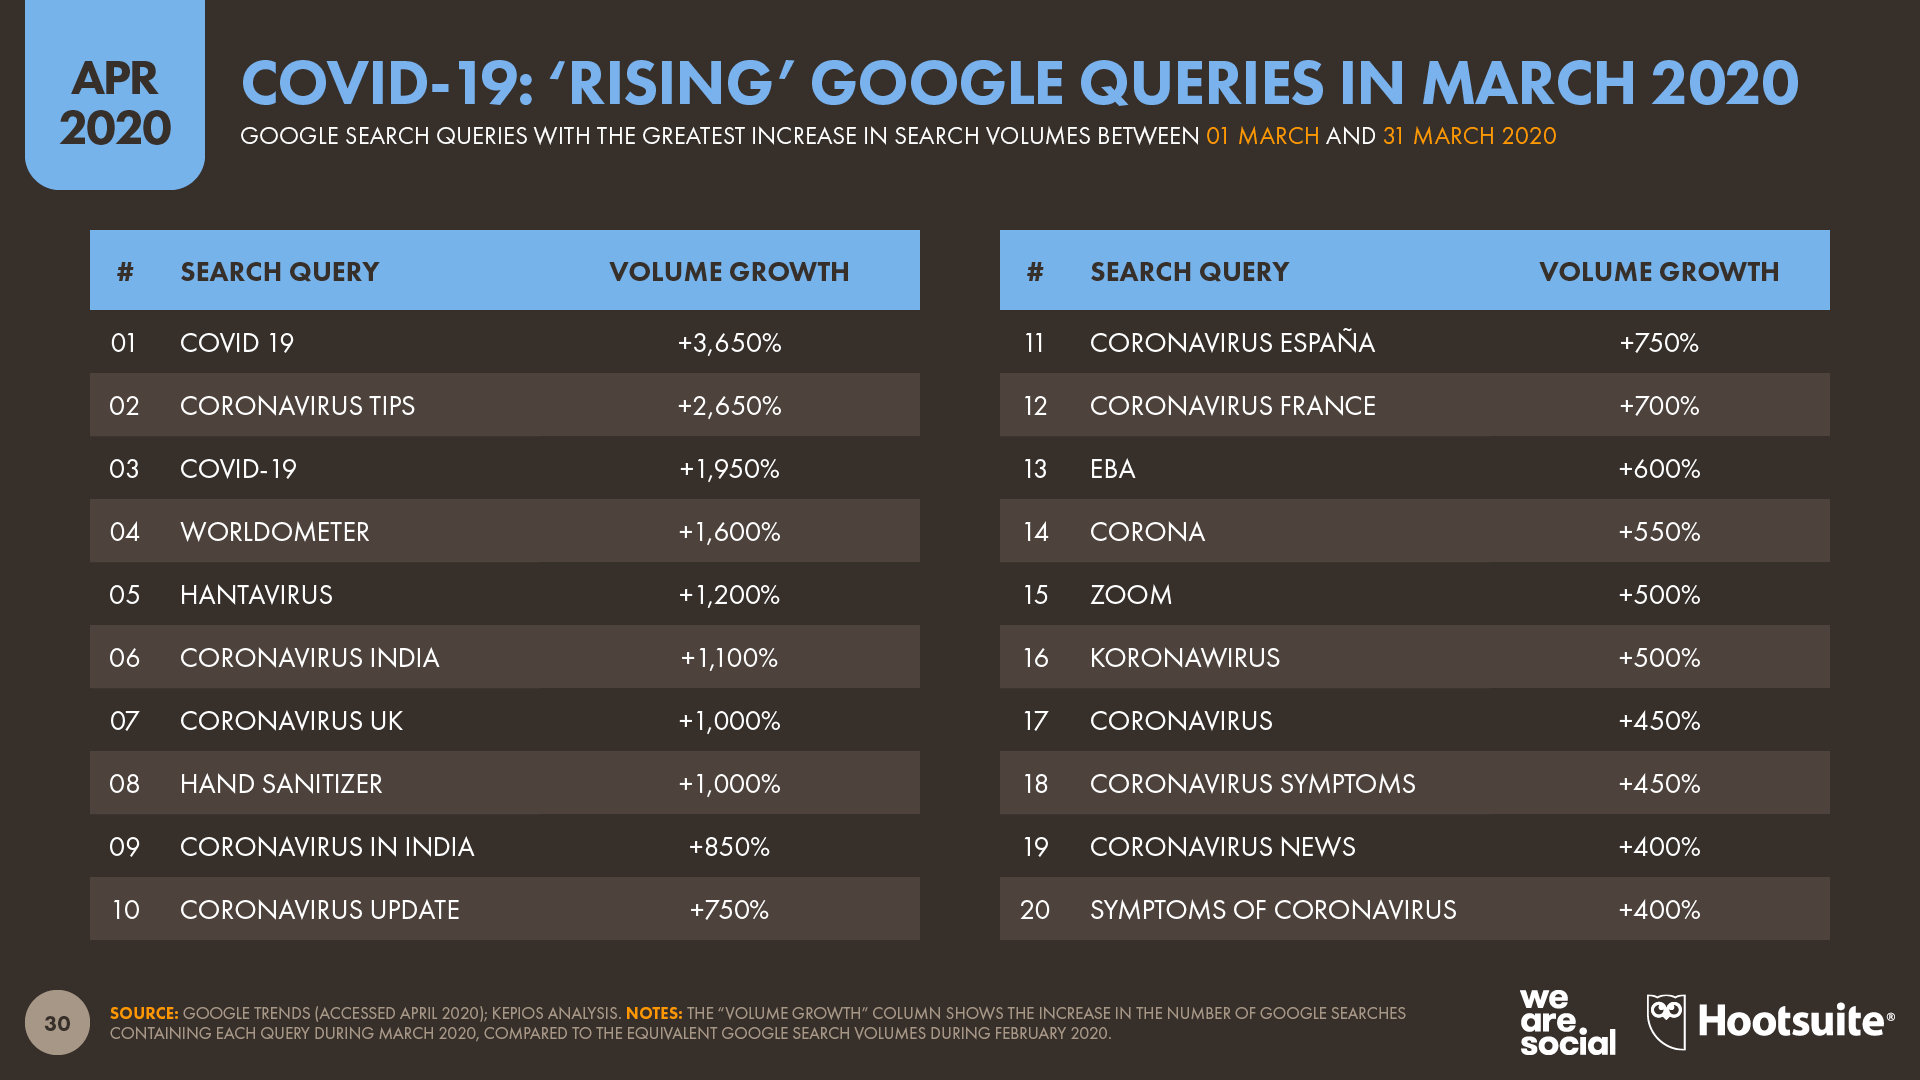
The ranking of queries by their month-on-month increases in search volume is even more telling, with 16 of the top 20 ‘rising’ terms in March 2020 directly related to coronavirus, and another three closely linked to the pandemic and its consequences.
The only term in Google’s ‘rising’ list for March that is not associated with the COVID-19 outbreak is “hantavirus”. It seems that searches for this query surged in recent weeks after a man in China died after being infected with the virus, but – despite an ensuing social media panic – guidance from America’s CDC suggests that the disease is likely to remain rare amongst humans.
If it hadn’t been for COVID… The trends we’ve identified in this quarter’s report have clearly been dominated by changes in behaviour that can be directly attributed to the coronavirus pandemic. However, there are some other stories we’ve been tracking that – under other circumstances – would have gained a lot more of our attention.
I’m guessing you’re probably suffering from a bit of data overload by now though, so I’ve distilled these stories down into the essential headlines.
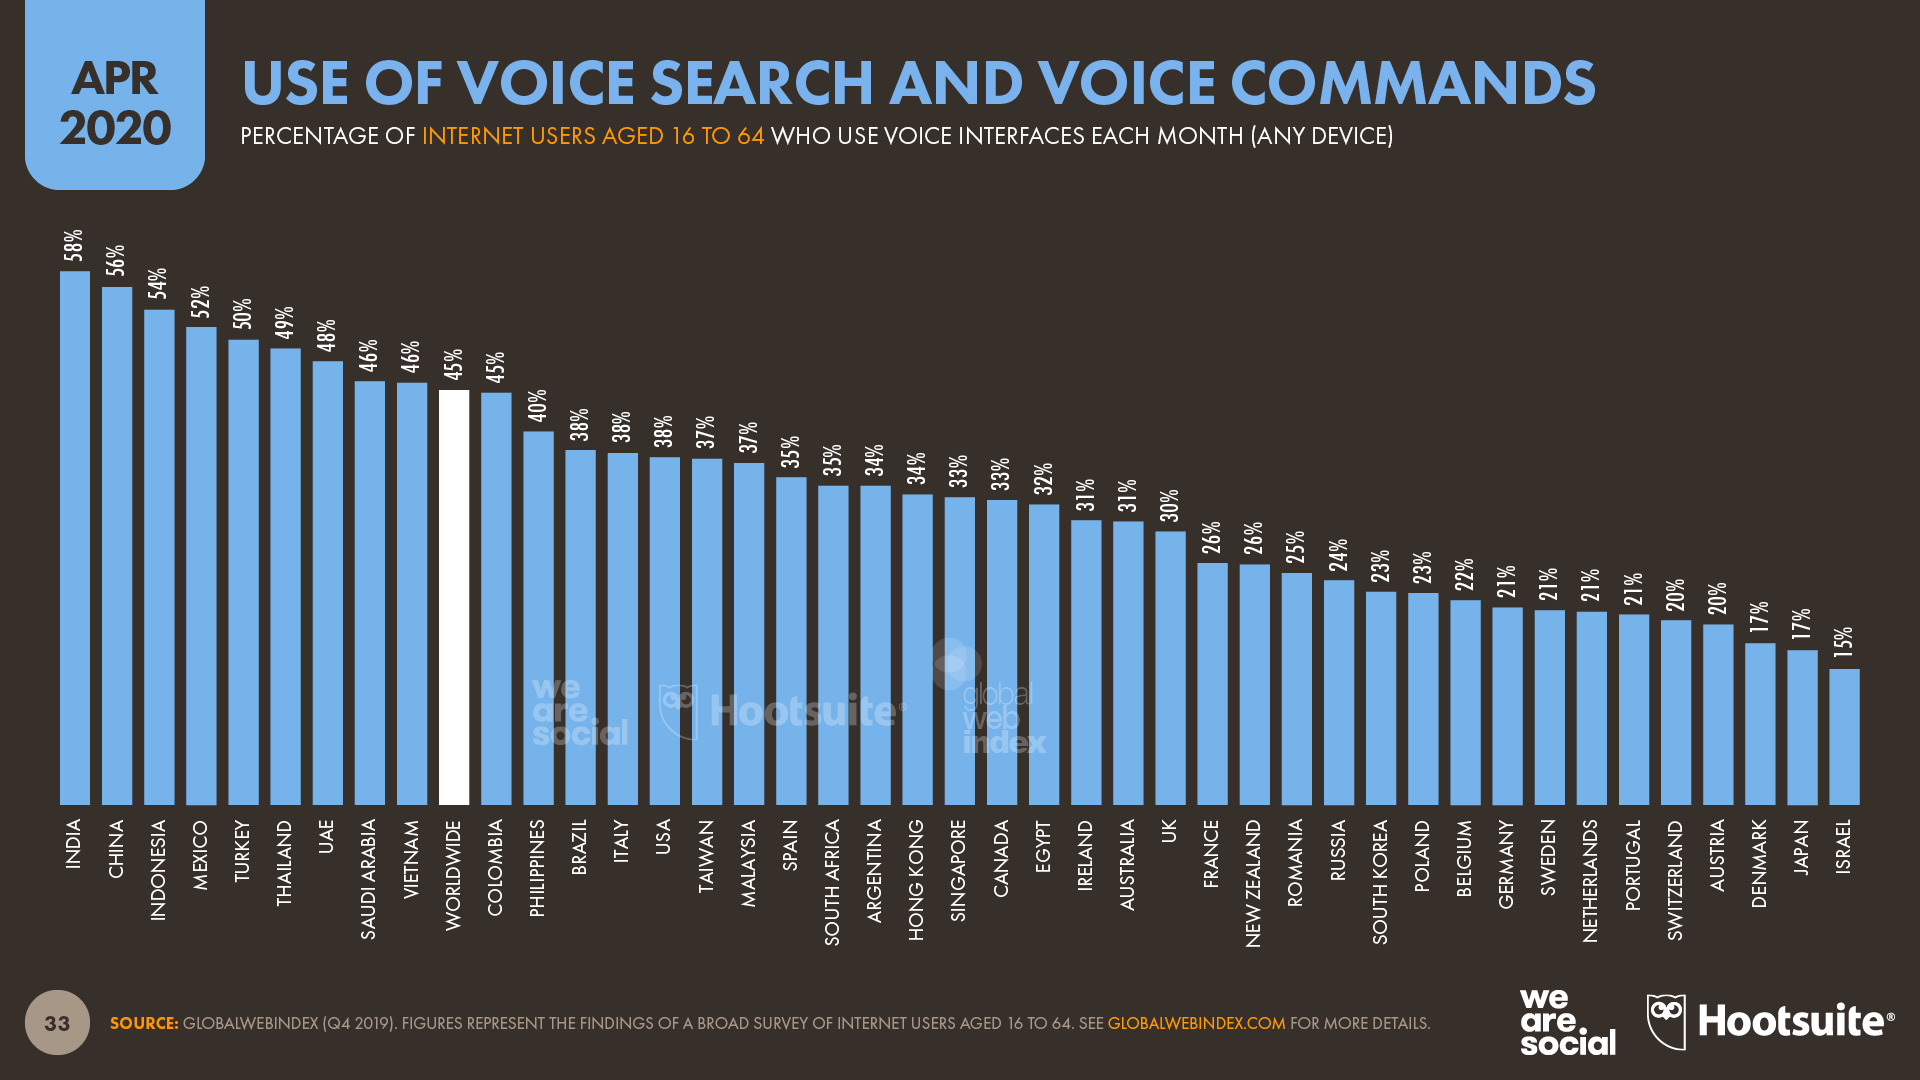
The use of voice interfaces continues to grow, especially on mobile devices. 45 percent of internet users now say they use voice search and voice commands each month, compared to the 43 percent that we reported in January. Furthermore, voice interface use now extends to more than half of internet users in India, China, Indonesia, Mexico, and Turkey. For context, these five countries represent some of the largest internet populations in the world, accounting for more than 40 percent of total global users.
Despite a persistent myth that Millennials and Gen Z don’t use email, the latest data from GlobalWebIndex shows that email use remains consistently high across all age groups. Critically, roughly three-quarters of internet users between the ages of 16 and 24 say they used a webmail service to read or send emails in the past month.
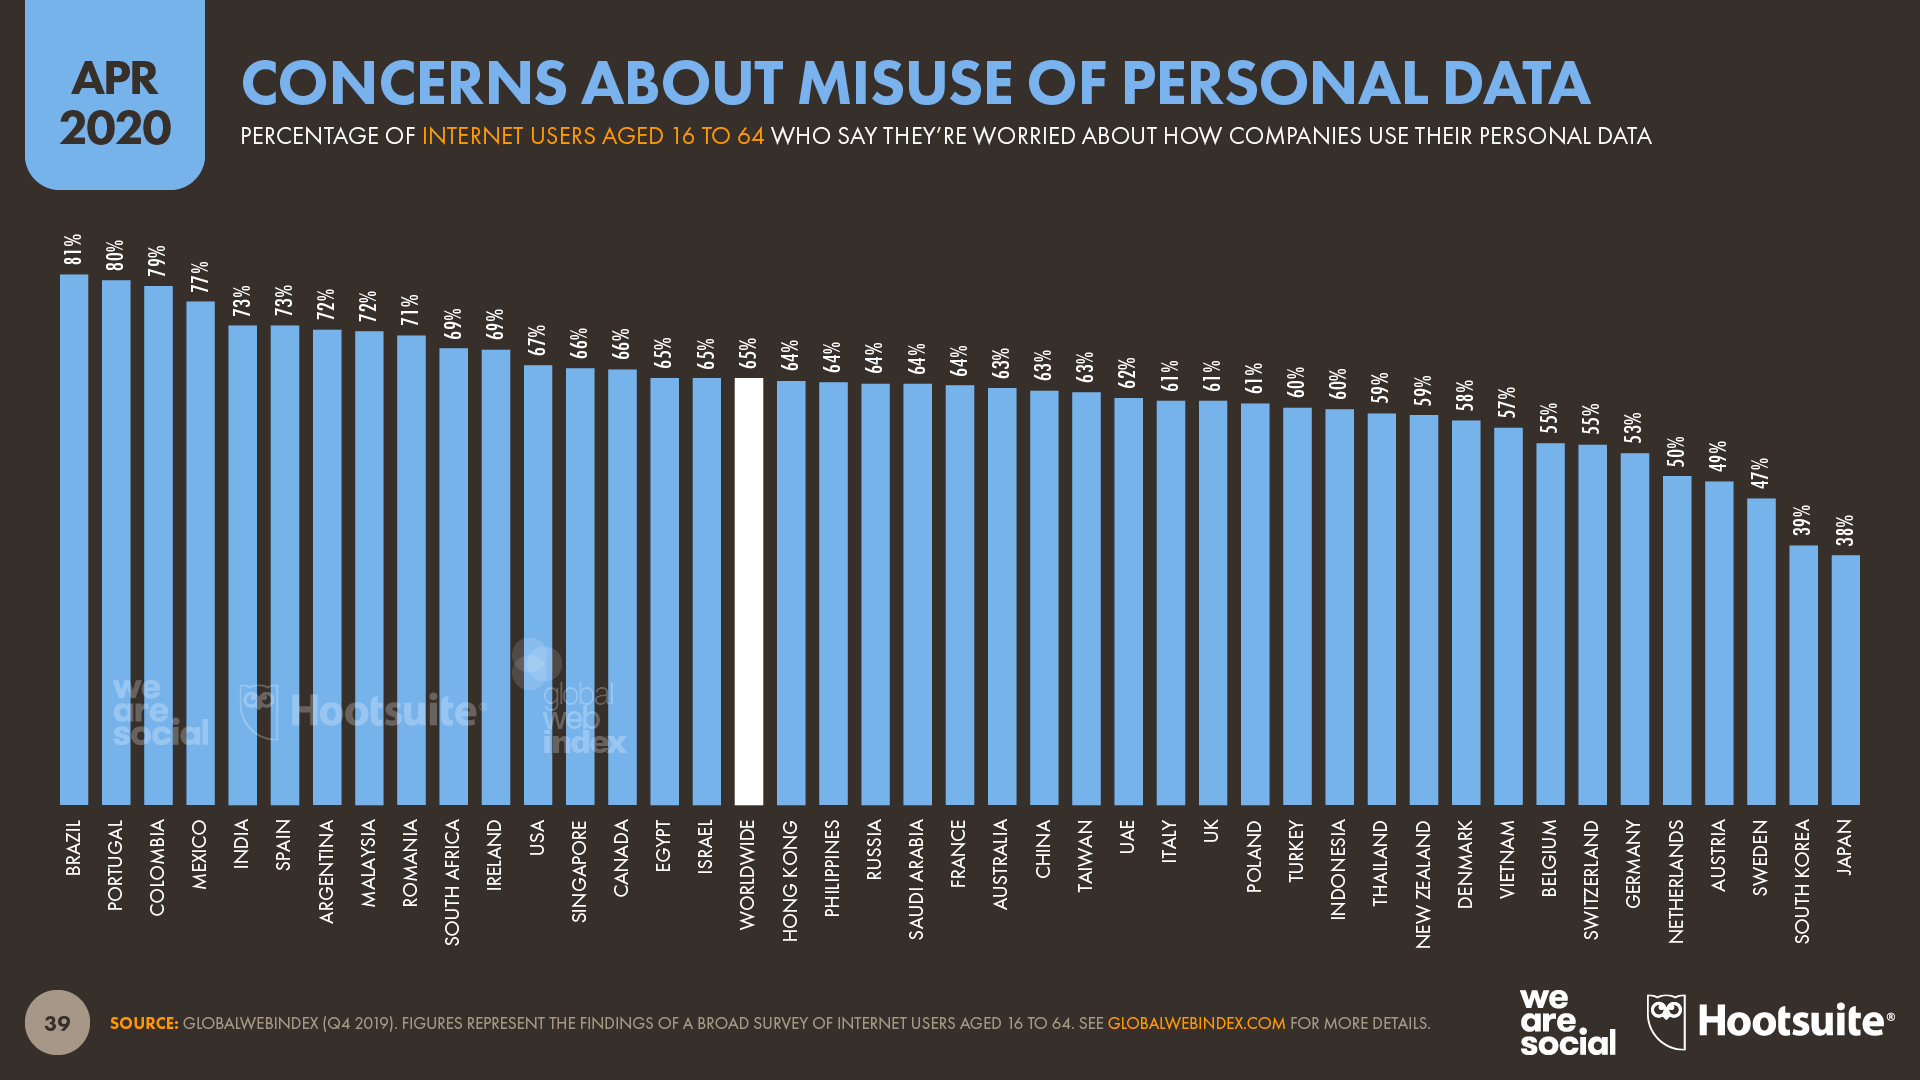
Concerns about misuse of data continue to rise around the world. 65 percent of internet users between the ages of 16 and 64 surveyed by GlobalWebIndex say they worry about how companies use their personal data, up from the 64 percent figure that we reported in January.
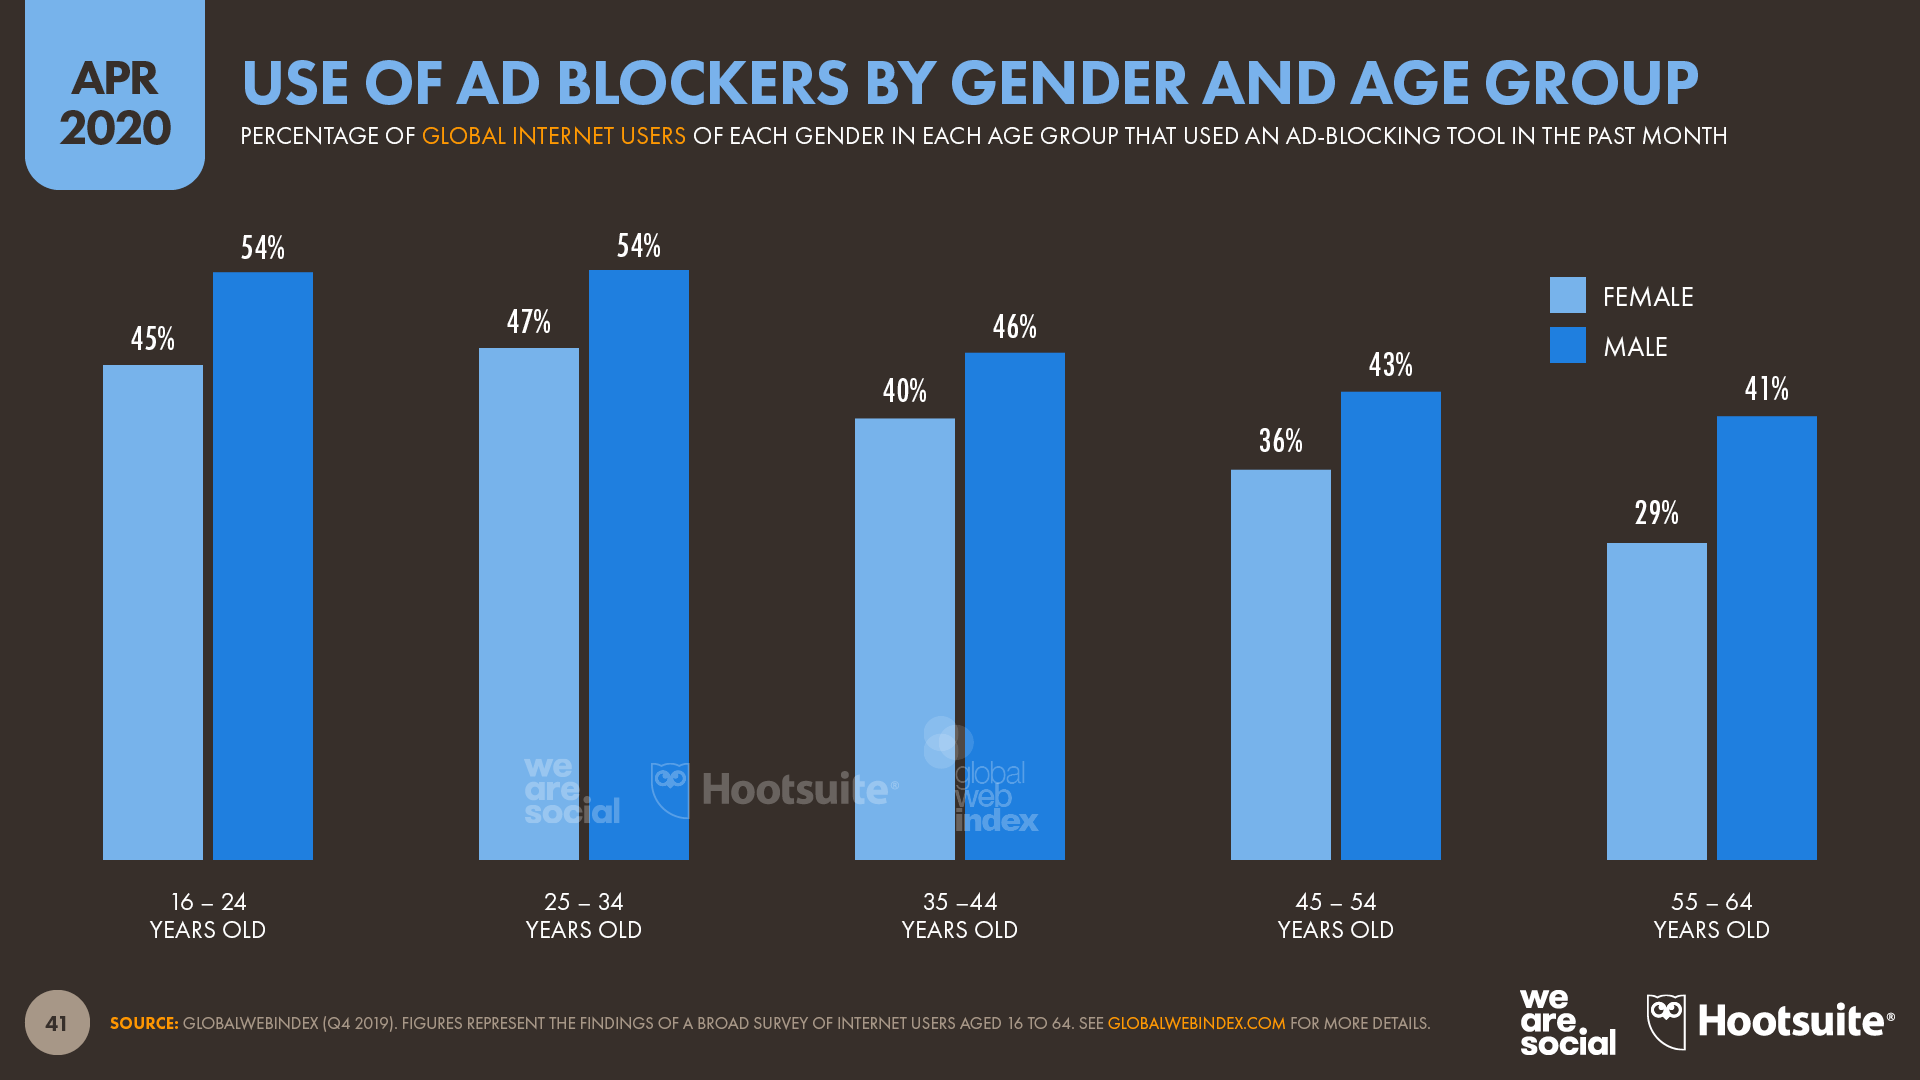
Younger users are the biggest users of ad-blocking tools, although men are considerably more likely to use these tools than women.
What happens next? No one knows how long the COVID-19 pandemic will continue to affect our lives, so it’s difficult to offer advice on next steps. However, here are some of the things I’d expect to see:
Use of video calling and teleconferencing services is likely to remain at higher levels than those we saw before the pandemic, even once lockdowns have been lifted. In particular, now that many companies have overcome the initial barriers to trial and implementation of these tools, it’s reasonable to expect that they will become a more integrated part of ongoing work routines, especially for replacing phone-based “conference calls”. However, I suspect that the novelty of ‘online socialising’ may wane once people are able to socialise in the ‘real world’ again, especially during the initial phases of the recovery as people make the most of being able to leave their homes.
With many people relying more heavily on online grocery shopping in recent weeks, I’d expect to see this new behaviour persist at higher levels than those we saw before COVID-19 lockdowns, albeit as part of a combination of online and offline shopping. This will have particular relevance for brands in the fresh produce category, which has seen some of the greatest increases in ecommerce relevance over recent weeks.
As companies continue to battle with the economic impact of lockdowns, advertising budgets may take many months to return to pre-pandemic levels. As a result, brands and their agency partners will need to experiment with more cost-efficient activities, with particular emphasis on organic distribution, as well as advertising channels and formats that can deliver more tangible returns to a brand’s bottom line. Creativity will also play a particularly important role, especially as the global mood fluctuates during recoveries and potential recurrences of the outbreak.
If conventional sports and sporting events continue to be suspended beyond the middle of the year, esports may attract increased interest from both sponsors and gambling companies. While it’s unlikely that esports will ever replace more ‘physical’ sports, brands that experiment with esports-related activities now will likely be better placed should that opportunity endure.
And finally… Amongst all the other growth trends we’ve been tracking over the past few weeks, there’s one that we can’t seem to escape. Specifically, an unprecedented increase in journalists’ use of the word “unprecedented” has led to unprecedented growth in the number of people searching for the word “unprecedented.” Fortunately, there’s an easy fix.