A mildly popular blog’s stats laid bare
Over the New Year break I decided to have a look at We Are Social’s stats for the year. It proved to be a worthwhile exercise and the deeper I dug into the data, the more interesting it got (and the longer this post took to finish). True to the spirit of social media, I’m going to share what I found.
For those of you less interested in We Are Social and more interested in generally applicable insights, you might want to skip ahead to the sections on other engagement measures and distribution factors, 2009’s most popular We Are Social posts, traffic sources, RSS/email subscribers, Twitter followers, Facebook fans, LinkedIn group members or my conclusions.
Prelude
We launched the We Are Social site and accompanying blog back in December 2008. We’d had a holding page live for the previous five months, which gave people the opportunity to subscribe to our feed by RSS or email, which certainly helped kick start things once we started publishing content. As individuals, we’d also been part of to the wider onine community for some time, through reading and commenting on other people’s blog posts, through our personal blogs and of course on Twitter. We were also pretty well known in the London social media / agency ‘scene’. All of these things meant people were pre-disposed to be interested in what we had to say, so let’s see how it worked out…
Top line figures
According to Google Analytics we had 88,664 unique visitors and 285,522 page views in 2009. Looking at this monthly, as you can see we’re hovering around 10,000 monthly unique visitors:

and just under 30,000 monthly page views:

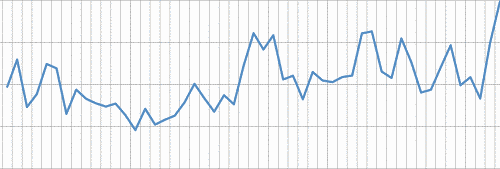
At this level, things look fairly comprehensible, with surprisingly shallow rises over the year but if you look at things on a daily basis, things are not quite as simple:

In this instance we’re looking at a graph of daily unique visitors, but the daily page views graph looks very similar. As you can see, long term trends are much harder to discern and the obvious conclusion is that individual blog posts (or the lack of them), their quality and their distribution are driving the peaks and troughs in traffic and in this view of the data, other underlying factors are obscured.
Other engagement measures and distribution factors
We’ve looked at how many people are reading We Are Social’s content, and how much of it. However, in the era of social media people are doing a lot more than just reading content, by subscribing, joining, following, bookmarking, tagging, sharing and/or commenting. These actions all indicate higher levels of engagement than just reading alone, and are major factors in the distribution of content. Forrester made this idea famous with their Social Technographics Ladder, and PostRank have put measuring this sort of engagement into practice with their PostRank methodology. PostRank have also shown that engagement is increasingly happening offsite, out in the wilds of social media and it’s important to remember often the engagement is relevant in isolation of the content.
Here’s how PostRank measured engagement with We Are Social’s content in 2009, with the vast majority of our engagement (79.9%) happening offsite in social media:

Looking at the engagement on a weekly basis:

You can see it correlating reasonably well with our weekly unique visitors:
So, how much individual posts are engaged with in social media is clearly a very important distribution factor.
2009’s most popular We Are Social posts
Before we move on, here are 2009’s most popular We Are Social posts (in terms of page views), along with their on and offsite engagement as measured by PostRank Analytics, so you can get a feel for yourselves for how it affected their distribution:
As you can see, although all the popular posts have high engagement figures, it’s clear there are other factors at play, with some posts looking like search may have been an important factor in their success (for example Why do people use Twitter? and Best Buy: A social media case study).
We can usefully look at some of these distribution factors and discern other underlying factors from a site-level perspective (the factors that explain when the weekly enagement drops to zero the weekly unique visitors graph only goes down to around 1.5k).
Traffic sources
So how are people finding our content? How big a deal are these social media distribution factors? After spending some time cleaning up the data in Excel, it breaks down as follows:
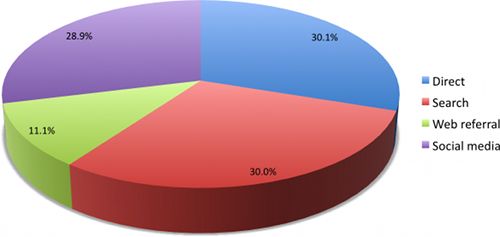
Here we can see the underlying factors. 30.1% of our visits are driven by people coming directly to our site (through typing in our URL or using a bookmark in their browser). 30% are from people arriving as a result of performing a search and clicking through to our site from a SERP. 28.9% are coming from some form of social media service (not including blogs) and 11.1% are arriving as a result of clicking on a link somewhere other than on a SERP or what we’ve defined as social media.
There’s almost a very neat 30:30:30:10 split between social media, direct traffic, search and referral links. So what does this tell us?
Social media has been the key to our success. Almost all of the web referrals will have come from links to We Are Social from people’s blog posts and blogrolls, meaning almost 40% of our traffic is coming from social media.
If you think about it, it is responsible for a lot more traffic than that – without all of those inbound links, we’d be getting nowhere near the same amount of traffic from search. And those direct visits? We can also assume a very large proportion of them are as a result of the reputation we’ve established using social media.
I’ll stop there, before I create some sort of social media singularity and crash the internets…
Breaking the out the direct and search visits, and looking at how they’ve changed:

Patterns in the direct visits are hard to discern, but you can see that search has grown reasonably steadily throughout the year, presumably as a result of our PageRank increasing with the number of inbound links and also as the amount of content has grown (meaning there are more pages to appear in search results).
Let’s look at some of these categories in more detail:
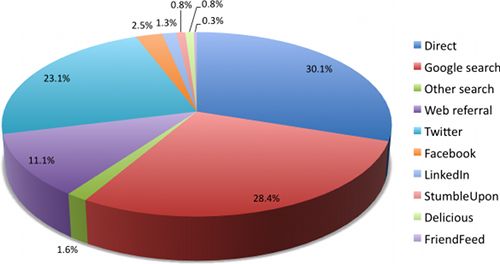
In terms of social media, Twitter dominates, driving almost 10 times the number of visits of that of its closest rival Facebook. Its scale compared to ‘proper’ social bookmarking services, such as StumbleUpon and Delicious, shows how Twitter has become a de facto social link sharing service (or as David Armano more eloquently puts it, the human feed), even if it was never designed as such. It surprising how little traffic Delicious is driving (0.8%), given the number of times our posts have been bookmarked on the service, and FriendFeed, acquired by Facebook in August, makes a very poor showing with only 0.3%.
It’s also worth noting how much Google dominates, accounting for around 95% of our search traffic, although to be fair, Bing only launched in the US in June ’09 and in the UK in November, and Google currently has around 90% market share in the UK.
Search terms
Looking at what search terms brought people to the site, they can be broken down into three categories:
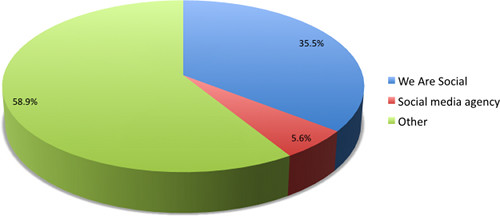
35.5% of people were ‘searching’ for We Are Social. These are equivalent to direct visits, with people using Google as their address bar, typing in terms like “We Are Social”, “wearesocial.net” etc. and clearly knew about us before their search.
5.6% are searching for a social media agency, by typing in terms like “social media marketing agency”, “online pr agency” and of course “social media agency”, for which we’ve ranked no. 1 for here in the UK for quite a while. I’d say this is a surprisingly low amount, considering how well we rank for these sort of terms.
58.9% are searching for something else entirely, something that Google thinks one of our pages answers, which knowing them, they probably do. It goes to show how effective a blog is at driving search visits…
Our audience
Looking at where our audience are, as you’d expect, nearly half of our visitors are from the UK, with the following breakdown across countries:
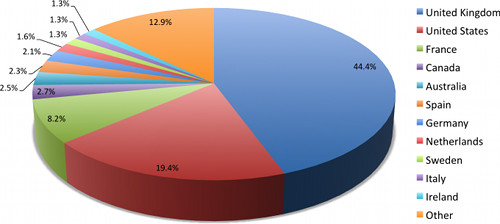
Our traffic is dominated by English speaking traffic from the UK, the US, Canada, Australia & Ireland and traffic from the rest of Western Europe, with the rest of the world not getting much of a look in. This is no great surprise given we have a blog written in English and we pitch ourselves as a European social media agency.
It’s worth noting that despite having a French site and blog running for the same amount of time as our main English one, France only accounts for 8.2% of our traffic. As some of you will know, we recently opened an office in Paris, and at the same time moved the French site from wearesocial.net/fr to wearesocial.fr so we’re hoping that this number decreases significantly here on .net but .fr’s growth is disproportionally larger.
RSS/email subscribers
We provide email and RSS subscription options to We Are Social which allow people to read the entire content of our blog posts without visiting our site (and thus appearing in Google Analytics stats), so it’s important we also understand how these are working.
We use FeedBurner to measure the number of RSS subscribers we have, and also to provide the email subscription service, and on the 31st December, we had 1,779 subscribers, of which 167 (9.4%) were email subscriptions.

As you can see from the graph above, this has grown pretty consistently throughout the year (the sudden jump in June was due to FriendFeed starting to share subscriber counts, and the few downward blips are just FeedBurner being screwy occasionally).
It’s important to remember though, that just because someone has chosen to subscribe, it doesn’t necessarily mean they’re actually reading the content. Of course, FeedBurner have thought of this and handily provide daily reach and feed item view figures.

As I’ve already shown, daily figures fluctuate massively, so for ease of comprehension, the above graph shows a 30 day moving average of RSS reach in red and for comparison, the 30 day moving average of We Are Social’s daily unique visitors from Google Analytics in blue. As you can see the RSS reach is equivalent to around 50% of We Are Social’s unique visitors. However, thinking about this in more detail, FeedBurner’s reach figure also includes clicks, which obviously would register in Google Analytics as visits and thus we’re in danger of double-counting.
FeedBurner’s feed item view figure seems safer though, as we can presume they only count a view when they serve an image embedded in the content of an RSS item, and if someone is seeing the content, there is no reason to click through to the site.
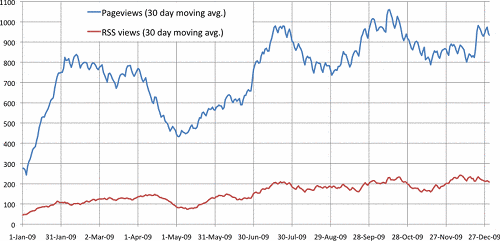
Above you can see the 30 day moving average of RSS views in red and the 30 day moving average of We Are Social’s daily page views in blue. On average, the daily RSS views are equivalent to 23.1% of We Are Social’s daily page views.
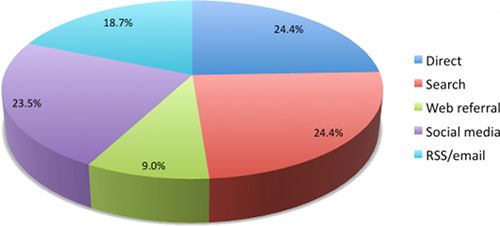
So despite the naysayers, it appears RSS is still very important. And if we go back to the pie chart looking at We Are Social’s traffic sources, it should actually look something like this (I haven’t separated out email and RSS as there’s no way of telling how views are distributed between them):
Twitter followers
We’ve also seen steady growth in our Twitter followers throughout the year (data taken from Twitterholic):

Like many news sites and blogs, we use the @wearesocial account mostly as a news feed for our blog posts and other announcements; although we do respond to those talking to us, it’s through our personal accounts that you’ll find us fully engaging, as you can see in the live stream of our individual Twitter conversations on the top-right of our blog.
We did experiment at different times last year with different techniques to grow an engaged follower base for a Twitter account with minimum effort, using the @wearesocial account as a testbed. We had some success with this, but ultimately our position remains as follows – the key to success is the simple technique of growing an account organically by being interesting to your target audience and engaging in conversation with them.
A larger factor in our follower numbers would be, we hope, the success (or not) of our blog and to a lesser extent of We Are Social itself.
Out of politeness we also follow back everyone who follows us. This behaviour probably accounts for a significant proportion of the growth and that of our 29,559 followers on December 31st 2009, only 66% were engaged users (according to Ad.ly Analytics – i.e. the other 34% were recognised as a bot, had abandoned their Twitter account, had been suspended from Twitter or simply were following way too many people).
As demonstrated by the above and by Anil Dash’s recent post about his experience of having nearly 300,000 followers, overall follower numbers are pretty meaningless and we much prefer Klout‘s way of measuring the influence of Twitter users (as does Google’s analytics guru). Currently @wearesocial has a Klout score of 63/100, not bad when compared to publications like @Econsultancy’s 46 or agencies like @Digitas’ 31 or @Razorfish’s 54.
However, if you were to draw conclusions on a per follower basis, in our instance RSS/email accounts for around 16 times the amount of engagement with our content per subscriber/follower when compared to Twitter.
Facebook fans
The number of fans we had on Facebook grew fairly steadily at a rate of around 75 fans a month, standing at 893 on December 31st:

We’d obviously like the graph to have been steeper, but as we’re only using our Facebook page to automatically post our latest blog entries (which people need to click through to our blog to read) and we’re not using Facebook social ads or any other method other than linking to the page from the sidebar of our blog to recruit fans, we’re pretty happy with this.
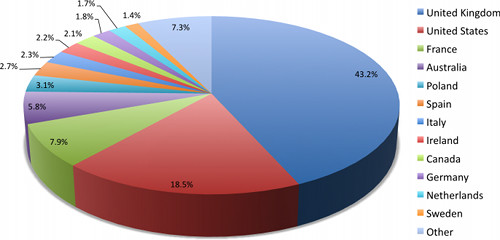
Aside from Poland’s surprise mid-table appearance, the geographic breakdown of our fans is similar to that of our website visitors above:
And bearing in mind what they are fans of, the demographic profile is again pretty much what you would expect:
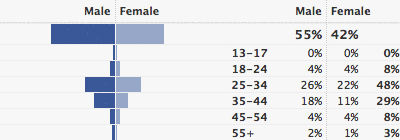
What’s more interesting though, as noted above, Facebook accounts for only 2.5% of our traffic, but we have around half the number of Facebook fans compared to RSS/email subscribers. Doing the math, RSS/email accounts for around 4 times the amount of engagement with our content per subscriber/fan when compared to Facebook (which as I’m sure you can work out, means Facebook accounts for around 4 times the level of engagement per fan/follower when compared to Twitter).
LinkedIn group members
Unfortunately LinkedIn keeps its group data fairly close to its chest, so no pretty graphs, but I can tell you we had 1,601 members of our LinkedIn group on the 31st December. If I had to guess, I’d say this has been growing organically in a similar way to our Facebook group.
Again, the interesting thing to note is that LinkedIn is only responsible for 1.3% of our traffic, and although there are plenty of other reasons to join, our blog posts do get automatically posted as news items in the group. Meaning RSS/email accounts for around 16 times the amount of engagement with our content per subscriber/member when compared to LinkedIn (which is broadly the same per member/follower as Twitter).
Conclusions
So, as you’ve seen, it’s an incredibly complex picture, and we should be wary of applying these findings universally, but what stands out for me is:
- success is about the quality of individual pieces of content
- offsite engagement drives significant traffic
- Twitter is the most important engagement factor by far
- RSS is far more important than you think
- social media underpins everything
And as for We Are Social, we had a great 2009. We ended the year in 85th in the AdAge Power 150, 67th in the social media category of PostRank’s Top Blogs of 2009 listings, and 9th in the list of the UK’s top marketing weblogs. Not bad for a site that was less than a month old at the start of the year.


