12½ trillion hours spent online, a new milestone in internet adoption, and new records for social media use. Kepios founder Simon Kemp takes us through the key headlines featured in Digital 2022.
If you expected digital to return to “business as usual” in 2022, you may want to reset those expectations.
Our new Digital 2022 Global Overview Report – published in partnership between We Are Social and Hootsuite – reveals that most of the connected world continues to grow faster than it did before the pandemic.
Big stories in this year’s report include:
Double-digit growth in social media users
Big gains for YouTube, Instagram, and TikTok
New insights into the world’s social media preferences
The rise of social commerce
Significant increases in the cost of social media ads
At almost 8,000 words, this article’s a bit of a beast, so get yourself comfortable, and prepare for a full-on feast of facts and figures.
Best-in-class data As always, I’d like to start by saying a very bigthank you to the world-class data partners who’ve made this year’s reports possible, especially:
Important notes Just before we get into the numbers, I’d like to encourage all readers to review our detailed notes on data, to understand how changes in data sources and methodologies may impact this year’s numbers.
Alerts to highlight include:
Internet users: delays in reporting due to COVID-19 may mean that figures for “year-on-year change” represent change over periods of more than one year.
Social media users:big changes in platform reporting mean that various numbers included in this year’s reports are not directly comparable with figures for the same data points featured in our previous reports. Where we’ve been able to calculate representative growth figures, we’ve included those growth figures within this year’s reports, but where we haven’t included growth figures, it’s likely that any comparisons with historical data will deliver incorrect values. As a result, please avoid comparing social media users and advertising audience figures in this year’s reports with figures published in our previous reports.
But without further ado, let’s dive into the data…
Top 10 takeaways I’d recommend starting with this video, which offers a handy summary of this year’s essential headlines and trends.
Once you’ve finished watching that, read on below for the full report.
Full report You’ll find our Digital 2022 Global Overview Report in the SlideShare embed below (click here if that’s not working for you), but read on below for my complete analysis of this year’s top findings.
Essential headlines
Here are the key figures you need to understand the ‘state of digital’ today:
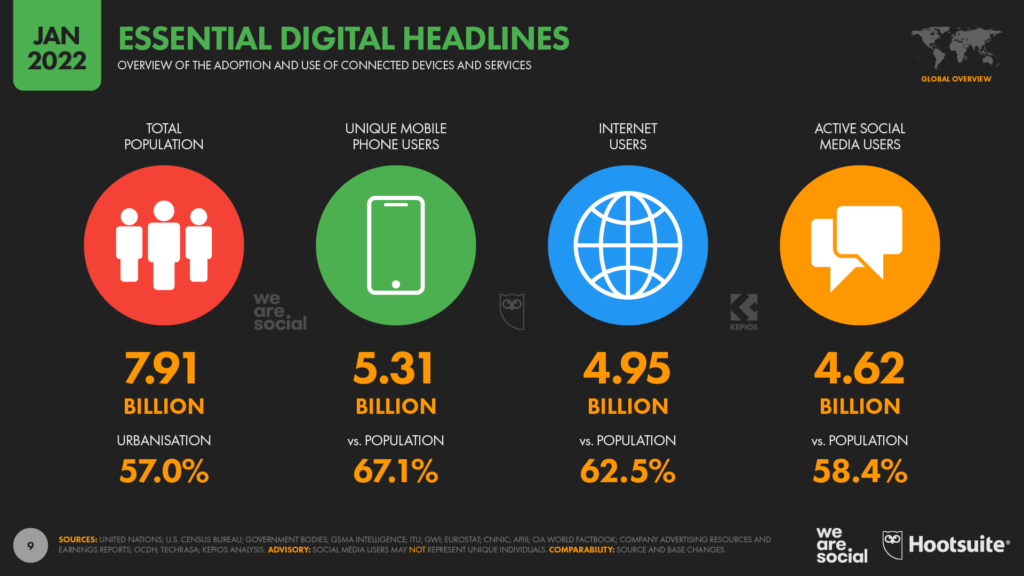
Global population: The world’s population stands at 7.91 billion in January 2022, with the annual growth rate of 1.0 percent suggesting that this figure will reach 8 billion sometime in mid-2023. Well over half (57.0 percent) of the world’s population now lives in urban areas.
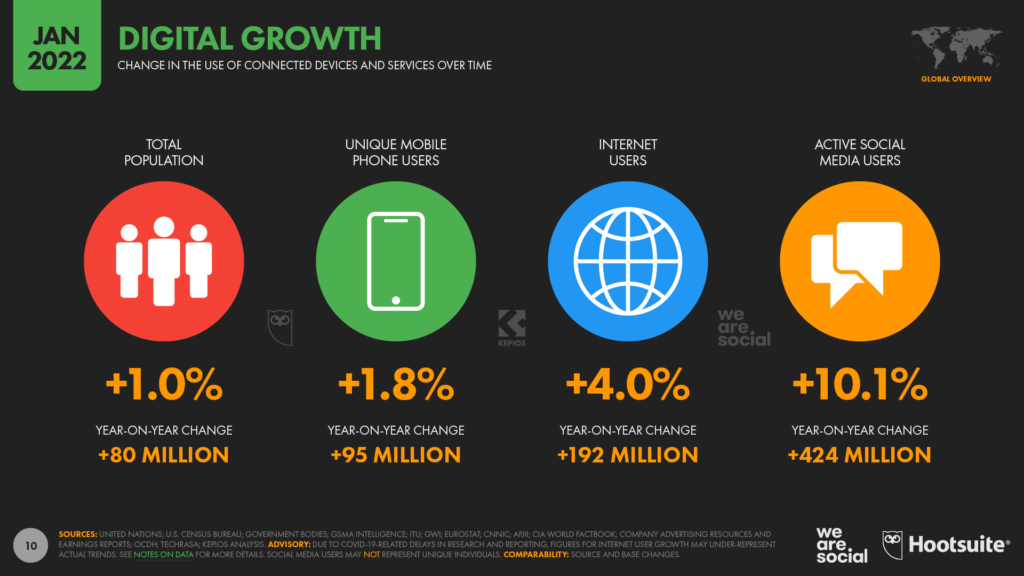
Global mobile users: More than two-thirds (67.1 percent) of the world’s population now uses a mobile phone, with unique users reaching 5.31 billion by the start of 2022. The global total has grown by 1.8 percent over the past year, with 95 million new mobile users since this time last year.
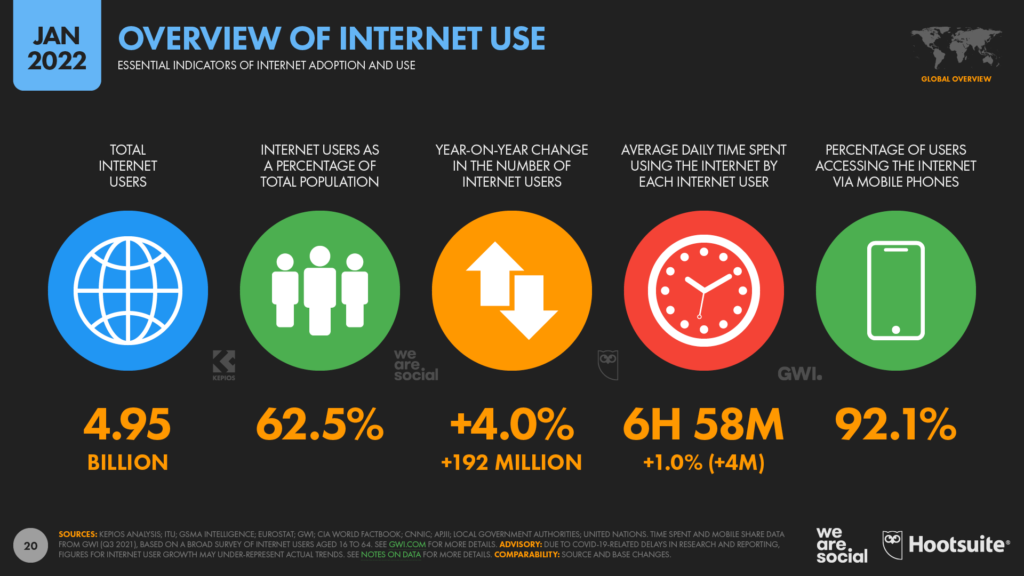
Global internet users: Global internet users have climbed to 4.95 billion at the start of 2022, with internet penetration now standing at 62.5 percent of the world’s total population. Data show that internet users have grown by 192 million (+4.0 percent) over the past year, but ongoing restrictions to research and reporting due to COVID-19 mean that actual growth trends may be considerably higher than these figures suggest.
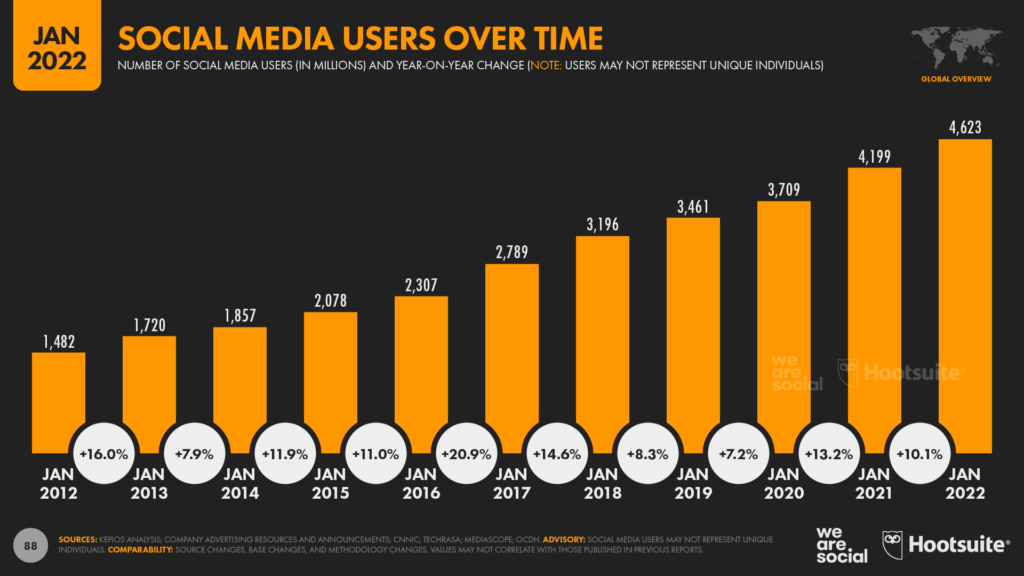
Global social media users: There are 4.62 billion social media users around the world in January 2022. This figure is equal to 58.4 percent of the world’s total population, although it’s worth noting that social media “users” may not represent unique individuals (learn why). Global social media users have grown by more than 10 percent over the past 12 months, with 424 million new users starting their social media journey during 2021.
These numbers provide valuable context for digital adoption and growth, but in order to make sense of what people are actually doing online, we need to dig deeper into the numbers.
And the good news is that we’ve got lots of numbers to dig into…
Adecade of digital growth This year marks the tenth anniversary of the first global report in our Global Digital Reports series, so we can now look back over a full decade of digital data.
If you’d like to indulge in a bit of nostalgia, you can find our first Global Overview Report here, while all subsequent reports in the series are also available in our free library.
You can also find my comprehensive analysis of key trends over the past decade in this in-depth article.
Note that considerably more data is available today than it was at the time we produced many of our earlier reports though, so some of the figures I’ll cover below may not match those that we published in previous reports.
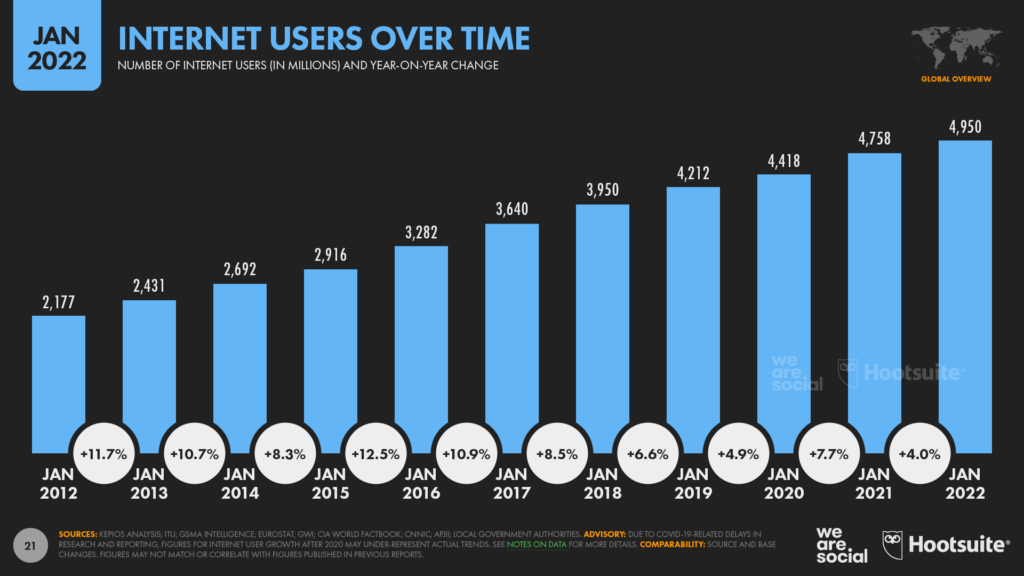
Internet user growth Kepios analysis reveals that internet users have more than doubled over the past 10 years, climbing from 2.18 billion at the start of 2012, to 4.95 billion at the start of 2022.
That results in a compound annual growth rate (CAGR) of 8.6 percent for the past decade as a whole, but – as you can see in the chart below – annual growth rates have fluctuated meaningfully from one year to another.
The latest data suggest that internet users grew by 192 million over the past 12 months, resulting in annual growth of just 4.0 percent in 2021.
However, we strongly suspect that this lower growth figure is more likely the consequence of challenges associated with collecting and reporting data during the ongoing COVID-19 pandemic, and that these numbers don’t reflect the actual growth in internet users over the past year.
As a result, there’s a very good chance that we’ll report higher numbers for growth between 2021 and 2022 once newer data becomes available.
Social media user growth Meanwhile, social media users have seen even faster growth than internet users over the past decade.
Today’s total of 4.62 billion social media users is 3.1 times higher than the 1.48 billion figure we published in 2012, and means that social media users have grown at a CAGR of 12 percent over the past decade.
Social media user growth has continued at a double-digit rate of 10.1 percent over the past 12 months too, but I confess I’m surprised that the growth rate between 2021 and 2022 has remained above pre-pandemic levels.
For context, the latest data indicate that 424 million users started their social media journey over the past year, equating to an average of more than 1 million new users per day, or roughly 13½ new users every single second.
However, anyone who had been wavering about joining social media before the pandemic struck would have been most likely to join during the early days of lockdown in 2020, so I’m hesitant to attribute any meaningful share of growth over the most recent 12 months to some kind of “COVID effect”.
Moreover, with social media users now equating to 58.4 percent of the world’s total population, we should expect to see growth rates start to decelerate over the next few years, and this may well be the last time that we report double-digit annual growth in social media users.
The good news is that we should see social media users reach the equivalent of 60 percent of the global population sometime in 2022 though, so even if growth rates do subside, the overall reach potential of social media should still offer plenty to get excited about.
Dig deeper:click here to learn more about what future digital growth rates might look like.
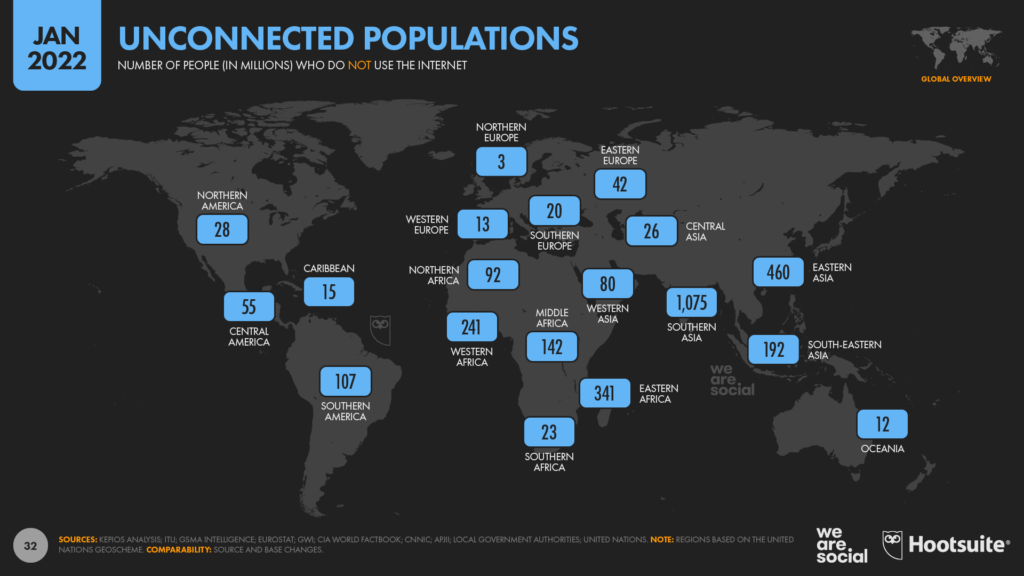
Even fewer offline, but big challenges remain Data reveal that the number of people who remain “unconnected” to the internet has now dropped below 3 billion for the first time.
This marks a significant milestone in the world’s journey towards equal digital access, and has particular relevance as the role of connected devices has moved from luxury to lifeline, especially during the COVID-19 pandemic.
However, the latest data also reveal that there’s plenty more work to do.
More than 1 billion people remain offline across Southern Asia, while almost 840 million people are yet to come online across Africa.
Meanwhile, despite accounting for roughly 1 in 5 of the world’s connected population, China is still home to more than 400 million of the world’s “unconnected”.
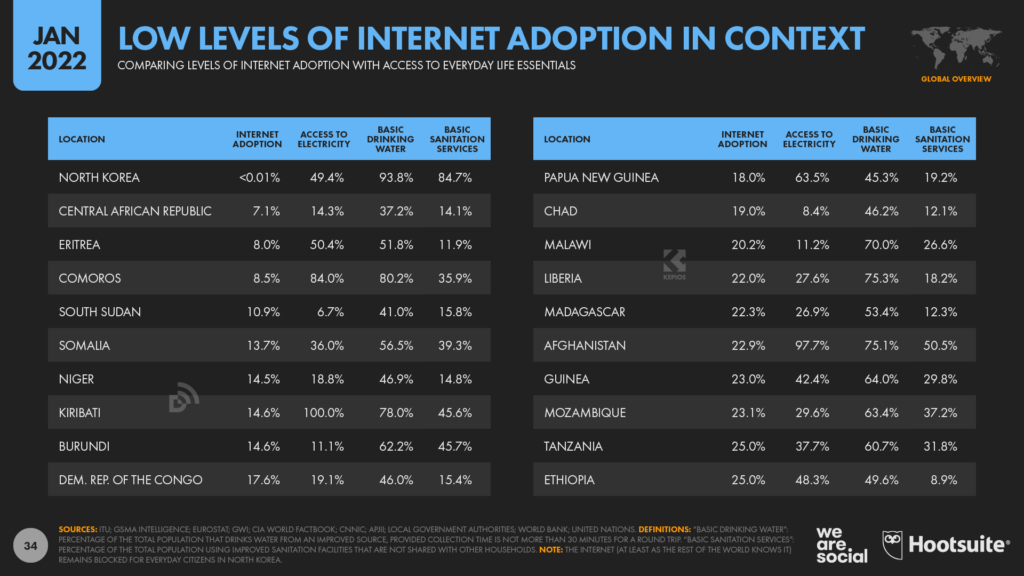
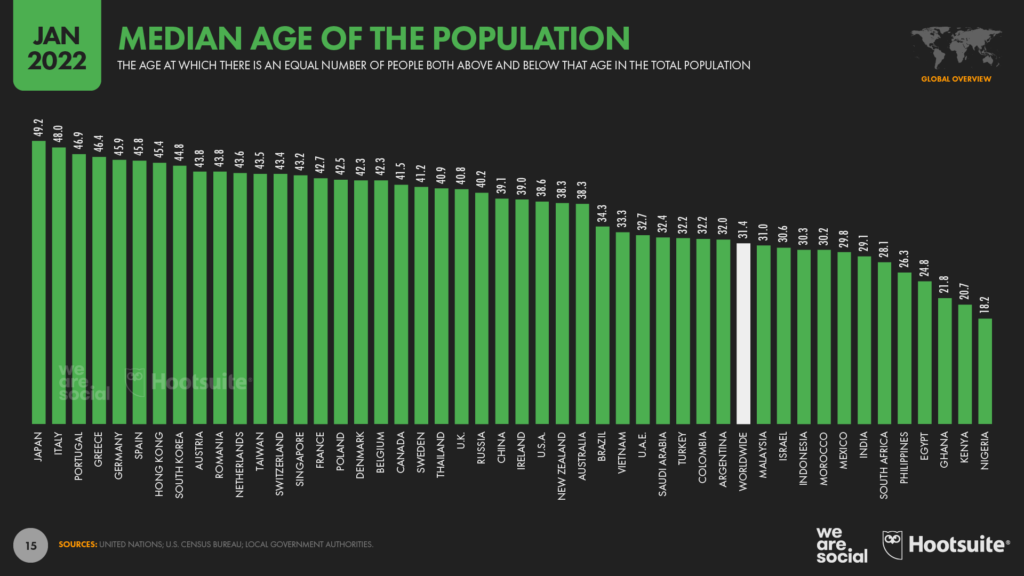
For context, the median age of the population plays an important role in shaping adoption levels across many parts of Africa, with more than half of the populations of several countries in the region still below the age of 20.
However, basic infrastructure challenges remain an important consideration too.
For example, in the Central African Republic – where internet adoption remains stubbornly low – barely 1 in 7 people currently has access to electricity, and the vast majority of people still don’t have access to basic sanitation either.
Furthermore, the excellent State of Mobile Internet Connectivity 2021 report from GSMA Intelligence reveals that 1 in 4 people across lower- and middle-income countries is still unaware of the existence of mobile internet.
In other words, hundreds of millions of people around the world may still not even know that the internet exists.
So, while the UN may have designated internet access a “basic human right”, there’s still a long way to go to ensure that everyone has equal access to what is arguably the most important innovation of our age.
Related:click here to learn more about the world’s top motivations for going online.
Social media favourites When it comes to the world’s “favourite” social media platforms, GWI’s latest data reveals that Instagram has now overtaken Facebook to claim second place in the worldwide rankings.
It’s still a close call though: 14.8 percent of global internet users identify Instagram as their favourite platform, compared with 14.5 percent for Facebook.
However, yet another Meta platform – WhatsApp – tops the global rankings, with 15.7 percent of working-age internet users choosing the messenger app as their favourite social platform.
Interestingly, WeChat gains enough votes to rank fourth at a global level, despite a whopping 99 percent of the platform’s votes coming from users within Mainland China.
China is home to roughly 20 percent of the world’s total internet users though, so it’s perhaps unsurprising that the country’s social media users have such a big impact on these global rankings.
However, you may be more surprised to see TikTok gain just 4.3 percent of the total vote.
That doesn’t quite match the excitement TikTok generates in the media, but it’s worth noting that the number of people choosing TikTok as their favourite social platform has jumped by 71 percent in the past 90 days, and TikTok’s overall share of the vote has increased by 180 basis points in just 3 months.
Furthermore, App Annie reports that TikTok was the most-downloaded mobile app in 2021, and the platform continues to enjoy strong growth in ad reach too (more on that below).
As a result, we might expect to see TikTok make even bigger gains in these rankings over the coming months, so be sure to follow our quarterly Statshot reports in 2022 to keep track of its progress.
Dig deeper: take a closer look at how social media favourites vary by age and gender in this article.
Time spent using connected tech continues to rise One of the top stories at the start of the COVID-19 pandemic was how much more the world came to depend on the internet, especially as countries entered lockdown.
However, despite fluctuations in movement restrictions over the past two years, the latest data show that people are in fact spending more time than ever using connected tech.
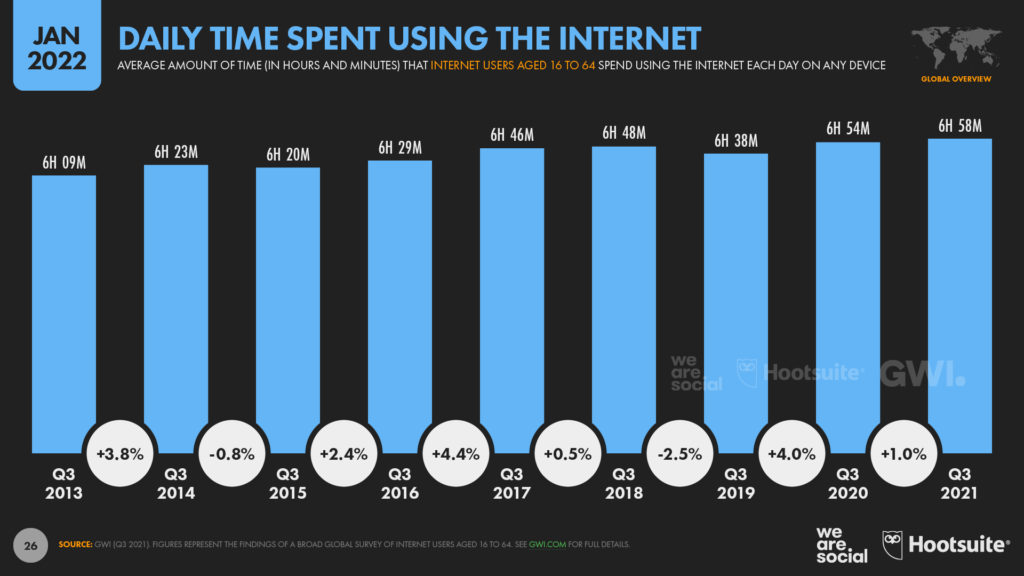
Internet time Research from GWI reveals that the “typical” global internet user now spends almost 7 hours per day using the internet across all devices.
For context, if we assume that the average person sleeps for roughly 7 to 8 hours per day, the typical internet user now spends more than 40 percent of their waking life online.
The amount of time we spend online continues to climb too, with the daily average increasing by 4 minutes per day (+1.0 percent) over the past year.
That may not sound like a big increase, but added up across all of the world’s internet users, those 4 extra minutes per day should equate to more than 5 billionadditional days of internet use in 2022.
In total, the latest numbers suggest that the world should spend more than 12½ trillion hours online in 2022 alone.
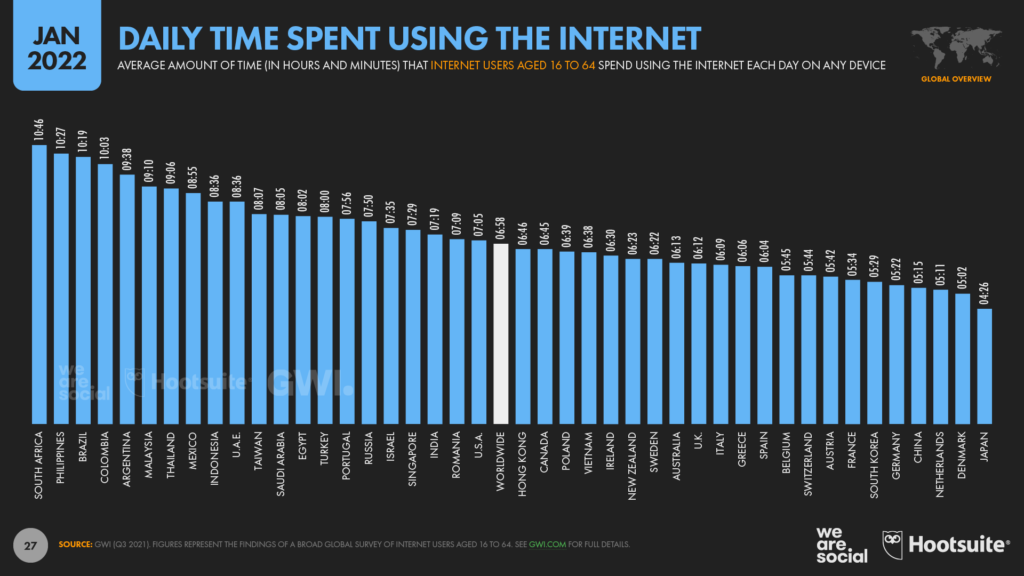
As with most data points in our Global Digital Reports, however, there are considerable differences in time spent by geography.
South Africans now spend the greatest amount of time online each day, with the country’s working-age internet users saying that they spend an average of 10 hours and 46 minutes using connected tech every day.
Filipinos, Brazilians, and Colombians aren’t far behind, with the average internet user in those countries each spending more than 10 hours per day online.
At the other end of the scale, Japanese users spend the least amount of time online each day, with the national average still below 4½ hours per day.
It’s also interesting to note that China sits quite far down these rankings, with the country’s internet users saying they spend an average of 5 hours and 15 minutes per day online.
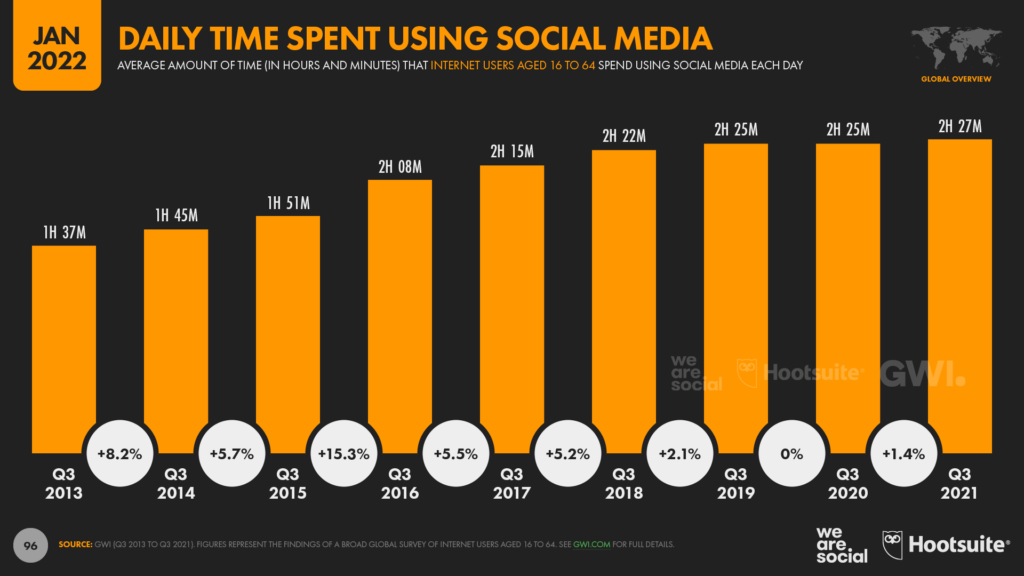
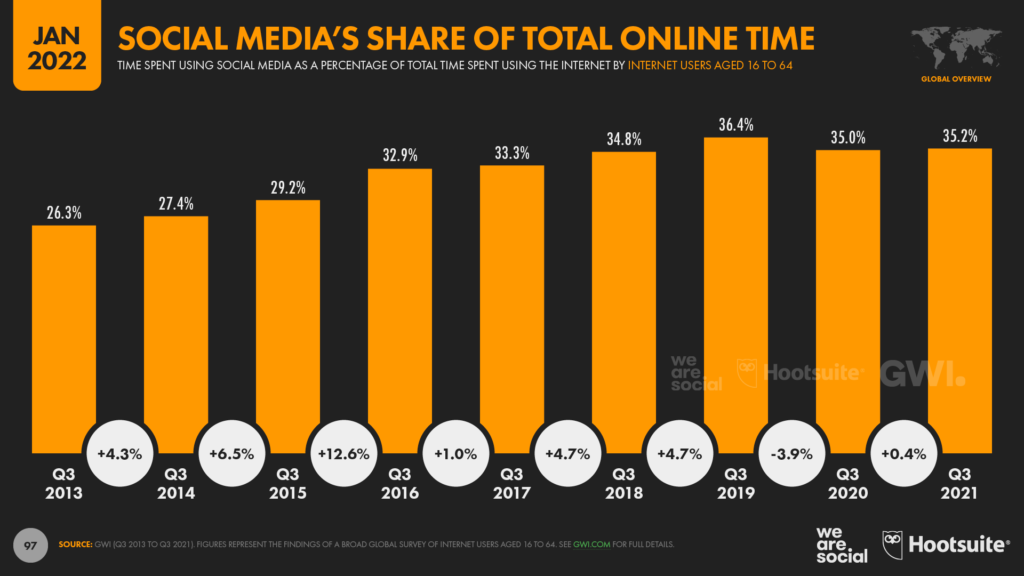
Social media time At an average of 2 hours and 27 minutes per day, social media accounts for the largest single share of our connected media time, at 35 percent of the total.
The time we spend using social media has grown again over the past year too, up by 2 minutes per day (+1.4 percent).
However, social media’s share of overall internet time has actually fallen slightly since the start of the COVID-19 pandemic.
Our analysis suggests that this is largely because people have embraced a variety of new online activities over the past two years, so – relatively – social media now accounts for a smaller share of total online time than it did when people did fewer things online.
However, with the world set to spend more than 4 trillion hours using social media in 2022, there’s little doubt that social media still plays a central role in our everyday lives.
Dig deeper: click here to see how social media time compares with time spent watching TV.
Social media time by platform But how does that social media time break down by platform?
Well, the good news is that the wonderful folks at App Annie have shared some great data with us this year that reveals how much time people spend using the Android apps of several top social platforms.
For context, handsets running Android account for roughly 7 in 10 smartphones in use around the world today, so – while these figures may not include all social media users – they still provide rich insights into how the world actually uses social media platforms.
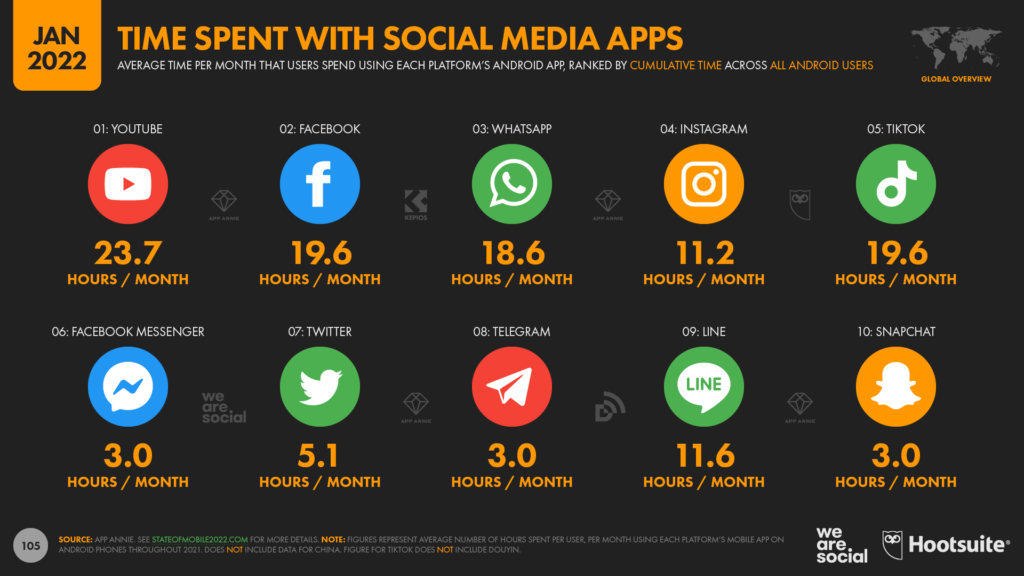
Overall, App Annie’s data shows that YouTube accounts for the greatest total time spent using social media apps on Android phones, and it also clocks the highest average time per user.
App Annie’s research indicates that the typical YouTube user now spends almost a full day – 23.7 hours – per month using YouTube’s mobile app, but remember that the platform likely also sees meaningful activity on its website, as well as via embeds on third-party websites.
Facebook comes second in terms of total, cumulative time spent using social media apps, with Android users averaging 19.6 hours in the platform’s app each month.
TikTok users also clock in an average of 19.6 hours per month using the TikTok Android app, but because the platform has fewer overall users, TikTok only comes fifth in these rankings by cumulative time spent across all users.
WhatsApp comes third in terms of total time spent, with users spending an average of 18.6 hours per month using the messenger app on Android phones.
Instagram ranks fourth, but users spend considerably less time using the app each month compared with the rest of the top 5, at just 11.2 hours per month.
At 11.6 hours per month, LINE also sees impressive average use rates, but with considerably fewer users overall, it only places ninth in the global rankings by total time spent.
For context, average monthly time per user has remained relatively stable across Facebook, YouTube, and WhatsApp over the past year.
Meanwhile, the time spent using Instagram has increased by 10 percent year on year, equating to almost 1 additional hour of use per month.
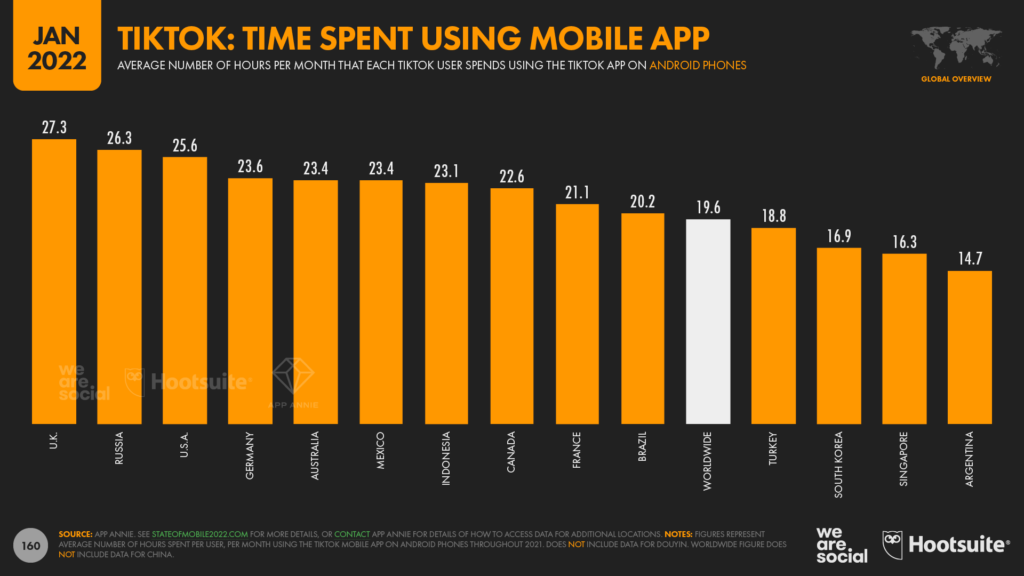
However, TikTok has seen the biggest gains across the top 5 over the past 12 months.
TikTok’s users now clock in an extra 6 hours and 20 minutes per month using the platform’s Android app compared with this time last year, equating to a year-on-year increase of 48 percent.
It’s important to stress that these figures vary considerably by geography though, and local rankings can look quite different to this global picture.
Dig deeper: Explore local data for time spent across the top 5 platforms in the full Digital 2022 report.
Facebook is still the most-used platform Insights into people’s “favourite” platforms and the time they spend using each one are perhaps the most representative data points for marketers preparing a social media plan.
However, active user numbers still provide valuable benchmarks, especially when it comes to understanding a platform’s momentum.
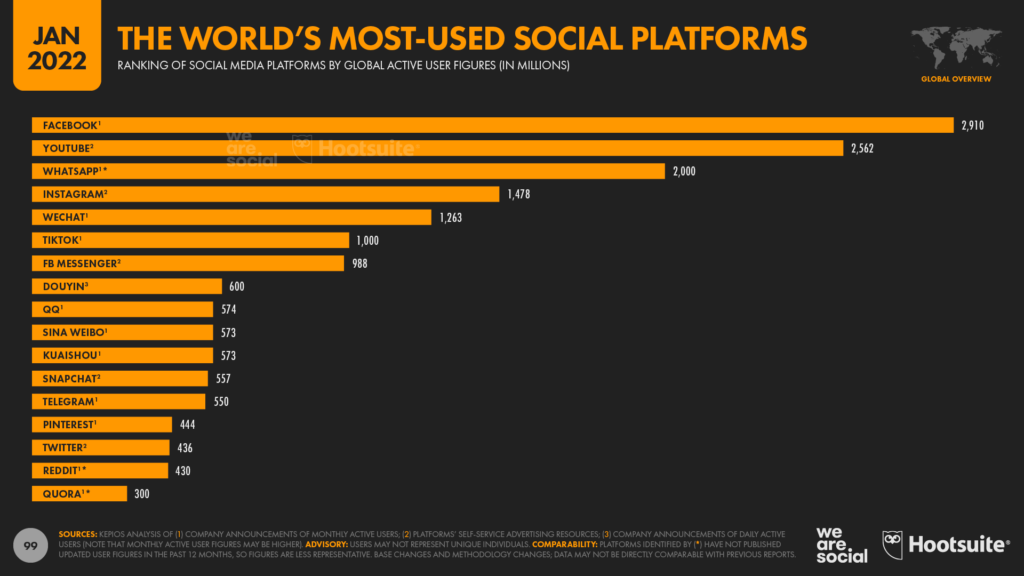
Data published in Meta’s Q3 2021 investor earnings announcement confirms that Facebook is still the world’s most-used social media platform, with 2.91 billion users as of October 2021 (the latest “official” figure at the time of writing).
Facebook’s monthly active user base grew by a solid 6.2 percent (+170 million users) over the past year, despite already reaching more than half of its total potential audience by age and accessibility (note that Facebook is still blocked in China).
YouTube has closed the gap with Facebook over the past year though, with the platform’s audience growing almost twice as fast as Facebook’s.
YouTube now has at least 2.56 billion active users, which equates to roughly 88 percent of the latest Facebook total.
However, note that the figures we publish for YouTube are based on the platform’s ad audience, whereas the figures for Facebook represent total monthly active users.
Meta hasn’t published any official updates to global WhatsApp user numbers in the past year, but it’s likely that the platform still ranks third, with at least 2 billion active users per month.
Instagram ranks fourth at a global level, and has seen some of the fastest growth of any platform in the past year (you’ll find more detailed analysis of Instagram’s growth later in this article).
WeChat closes out the top five, with China’s favourite social media platform now claiming 1.26 billion monthly active users.
However, all eyes will doubtless be on TikTok, which currently sits in sixth place in these active user rankings.
Bytedance announced that the platform had passed 1 billion monthly active users back in September 2021, but the company has been characteristically tight-lipped since then, so that figure remains the latest “official” number.
However, it’s worth noting that TikTok’s active user base roughly doubled between December 2019 and September 2021, and with the platform still claiming top spot in the global app download charts, it’s almost certain that TikTok’s monthly active users continue to grow (more on that below).
Meanwhile, Meta hasn’t published an “official” monthly active user (MAU) number for Messenger since September 2017, so we’ve decided to use the platform’s latest ad audience reach figure in these rankings, instead of that older MAU headline.
Note that LinkedIn doesn’t publish active user numbers, which is why we’re unable to include it in this list.
Dig deeper: stay up to date with all the latest social media stats via our dedicated platform pages.
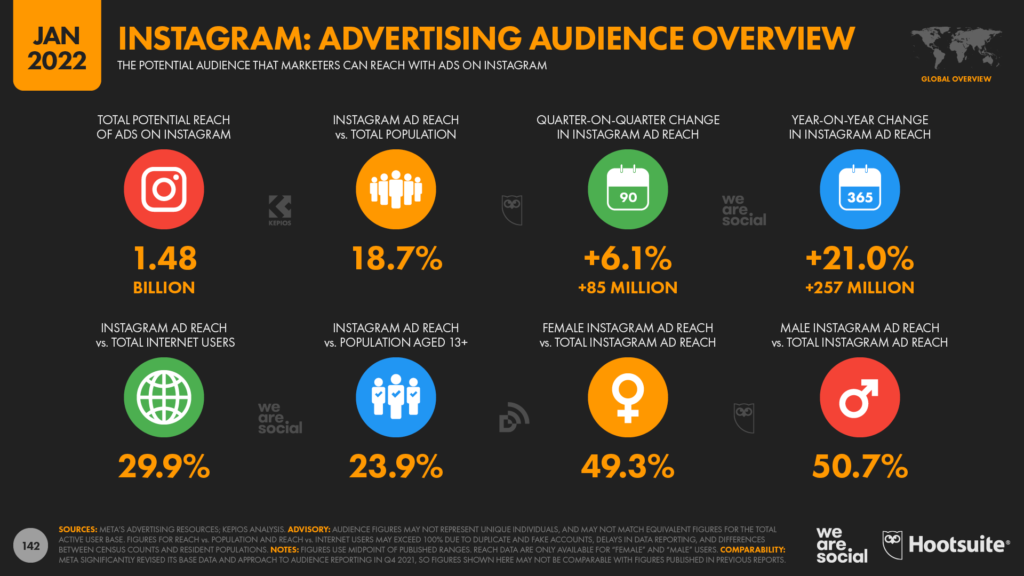
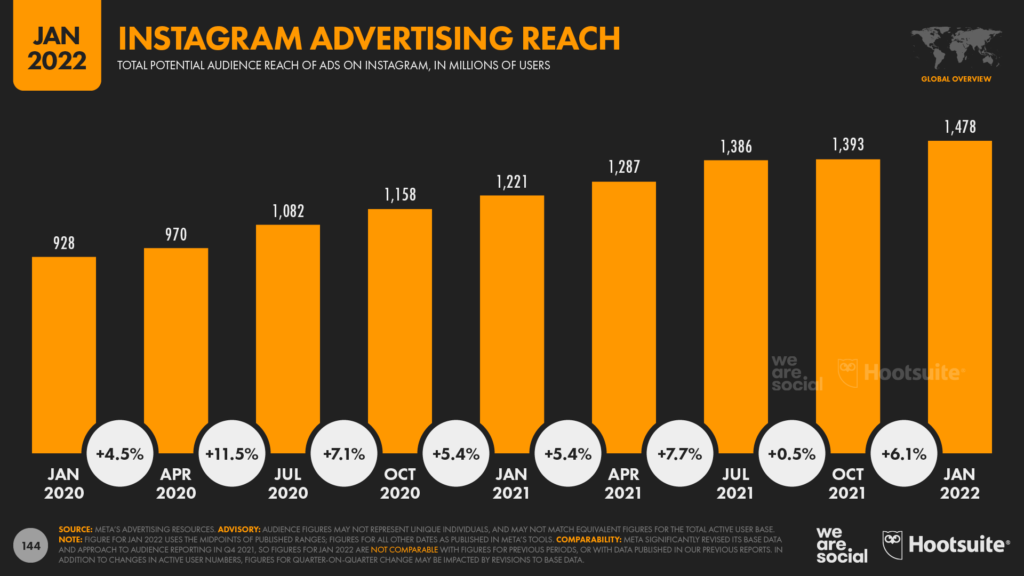
Instagram keeps growing The latest data published in Meta’s advertising resources shows that Instagram’s ad reach has jumped by an impressive 21 percent over the past year, despite important changes in how the company reports its ad audience numbers.
Meta’s own data suggests that more than a quarter of a billion new users joined Instagram during 2021, pushing the platform’s global ad reach to almost 1.5 billion users by the start of 2022.
What’s more, Instagram’s audience grew by more than 6 percent (+85 million users) in just the past 90 days, which suggests that its growth rates continue to accelerate
Instagram has been posting impressive quarterly growth rates for some time now, and our analysis of the company’s ad reach numbers indicates growth of almost 60 percent over the past 2 years.
Our Digital 2022 Global Overview Report also includes data for some of Instagram’s individual ‘environments’, which will be particularly useful for marketers exploring opportunities such as short video formats and social search.
For context, ads in Instagram’s “home feed” reach almost all (96.6 percent) of Instagram’s active user base each month, so these placements remain the surest way to reach the largest Instagram audience.
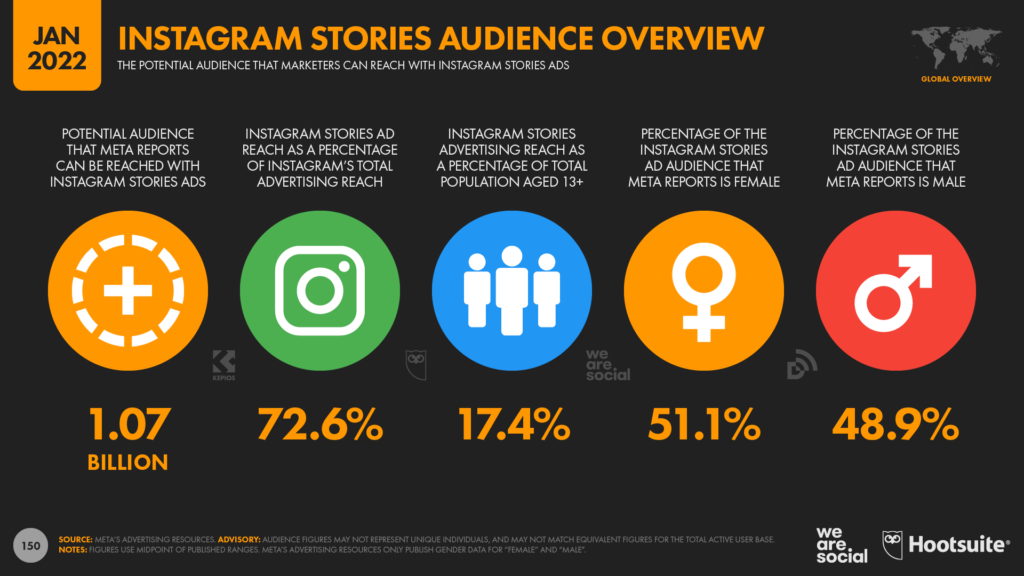
However, ads in Instagram Stories now reach more than 1 billion users each month, and – with the format’s additional functionality and creative options – the Stories environment represents an ever more compelling opportunity.
Meanwhile, slightly less than 800 million users also see ads in Instagram’s Explore tab each month.
This finding may have added relevance for marketers launching new brands and products, because users browsing the Explore tab are more likely to be looking for new content, ideas, and inspiration.
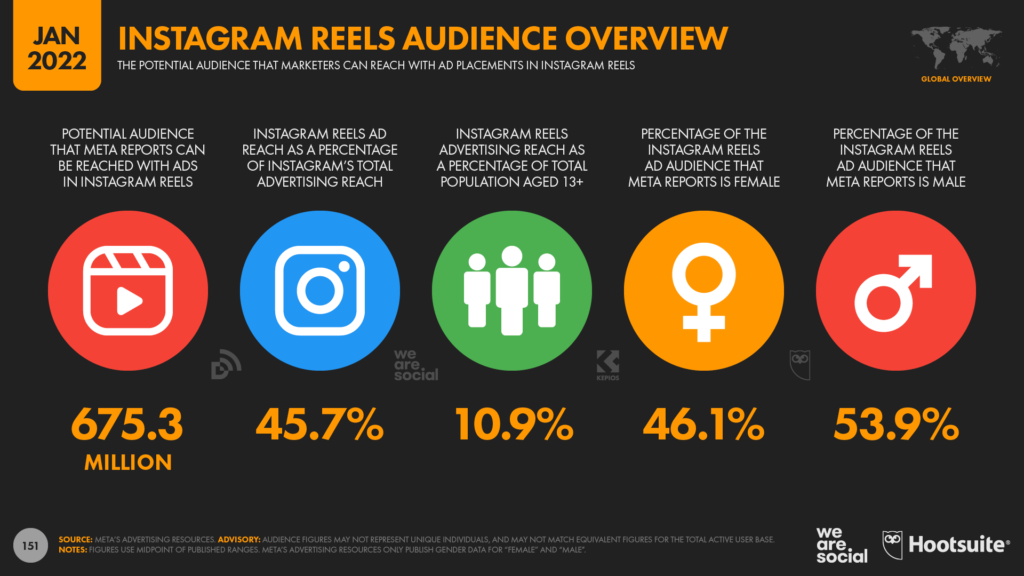
Reels haven’t quite gained the same momentum as Stories yet, but data reveals that 675 million Instagram users still see ads in the platform’s dedicated video tab each month.
We’ll take a closer look at Instagram Shop in the social commerce section later in this article.
Dig deeper:click here to explore the demographics of Instagram’s various ad audiences.
TikTok’s rapid rise continues TikTok’s ad audience also continues to grow at an eye-watering pace.
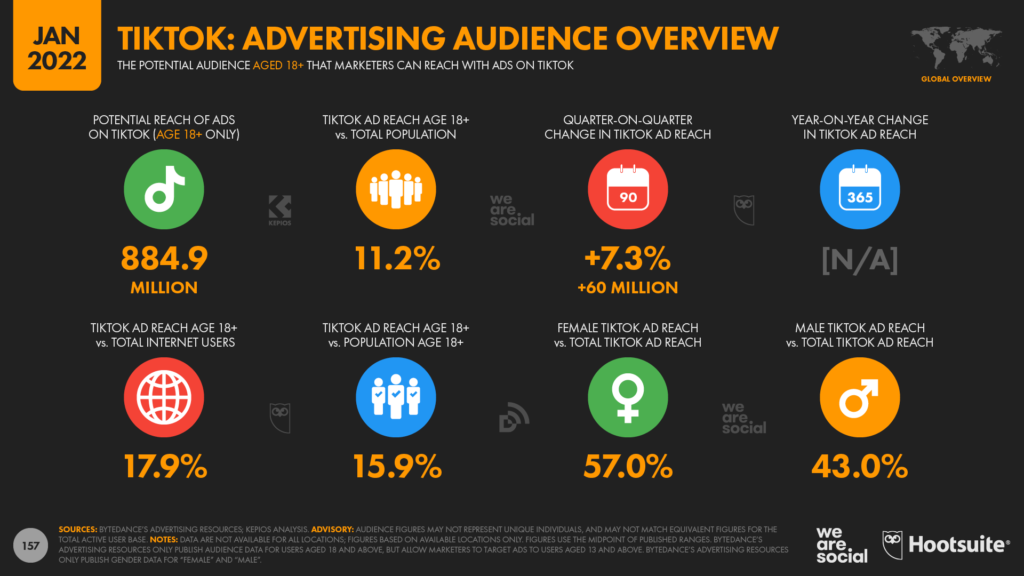
The latest figures published in Bytedance’s advertising resources indicate that TikTok’s ad reach increased by 60 million users (+7.3 percent) in just the past 90 days, taking worldwide ad reach to roughly 885 million by the start of 2022.
However, it’s important to stress that this figure doesn’t include users below the age of 18, who likely make up a sizeable share of the platform’s total active user base [note: due to what the company describes as “data security requirements”, Bytedance’s tools only show ad reach data for audiences aged 18 and above, although marketers can still target ads to users aged 13 and above].
The latest data suggest that TikTok has been adding an average of more than 650,000 new users every day over the past 3 months, which equates to almost 8 new users every second.
And what’s more, despite stereotypes, TikTok isn’t just popular with younger users.
Ad audience data for TikTok users aged 18 and above indicates that more than three-quarters of all adults in Saudi Arabia, the United Arab Emirates, and Kuwait already use the platform.
Meanwhile, TikTok users aged 18 and above in the United States now equate to more than half (50.3 percent) of all American adults.
As with all social media audience data in our Global Digital Reports, “users” may not represent unique individuals, but either way, it’s clear that TikTok has already made a huge impression around the world, and is also an increasingly popular choice.
Dig deeper: read more about TikTok’s rise and audience profile by clicking here.
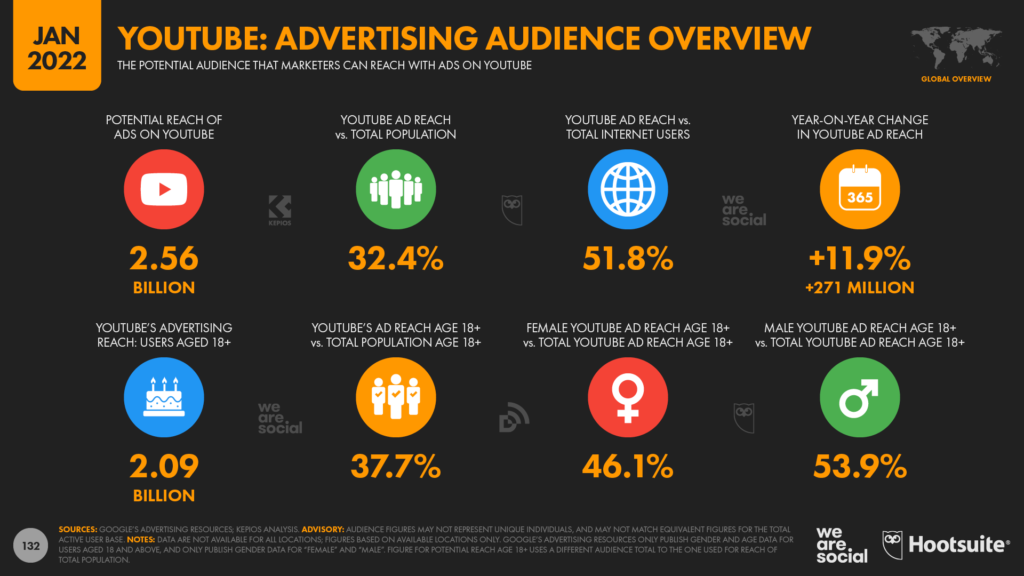
YouTube’s ad reach passes 2.5 billion Our latest analysis reveals that ads on YouTube now reach more than 2½ billion users, with that figure increasing by a hefty 11.9 percent (+271 million users) over the past 12 months.
What’s more, these figures only account for users in around 75 of the world’s larger economies, so there’s a very good chance that the total reach of YouTube ads is considerably higher than these published figures suggest.
The available data indicate that YouTube ads now reach roughly 1 in 3 people on Earth, with that figure rising to 37.7 percent of adults aged 18 and above.
However, if we focus only on those countries for which data are available, a far more impressive story emerges.
YouTube ads now reach more than three-quarters of adults aged 18 and above across most of the Western world, and more than 90 percent of all adults in a total of 14 countries.
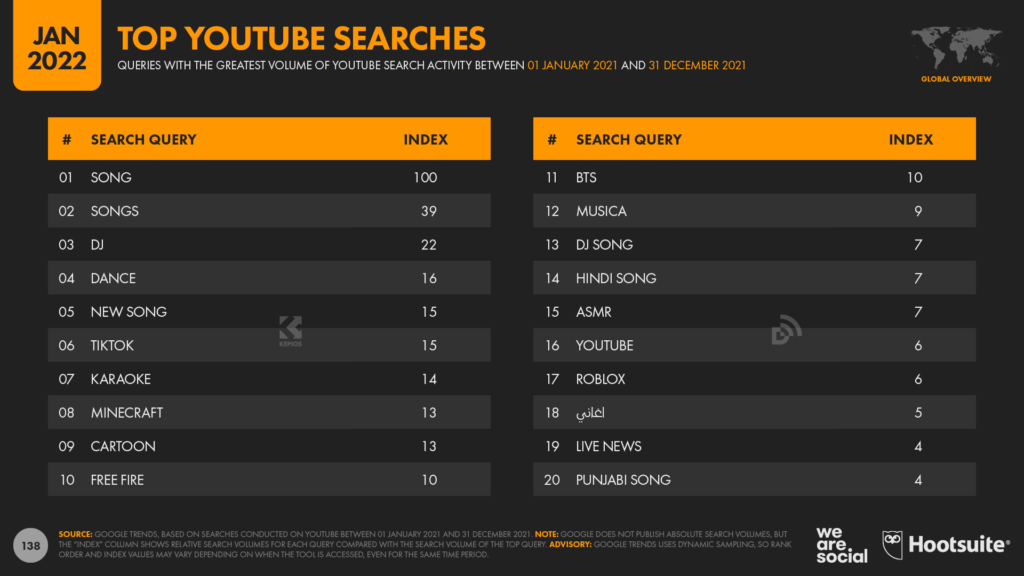
Beyond impressive reach numbers, marketers may also be interested to learn that music is increasingly important for YouTube’s global audiences, with 11 of the platform’s top 20 search terms over the past year relating directly to music.
This trend is also evident in our ranking of the platform’s most-subscribed channels, as well as our updated ranking of the platform’s all-time most viewed videos – both of which you’ll find in the full report.
Dig deeper: discover what YouTube users have been watching in our more granular analysis.
Related:click here to learn more about how the world’s online video and music habits are changing.
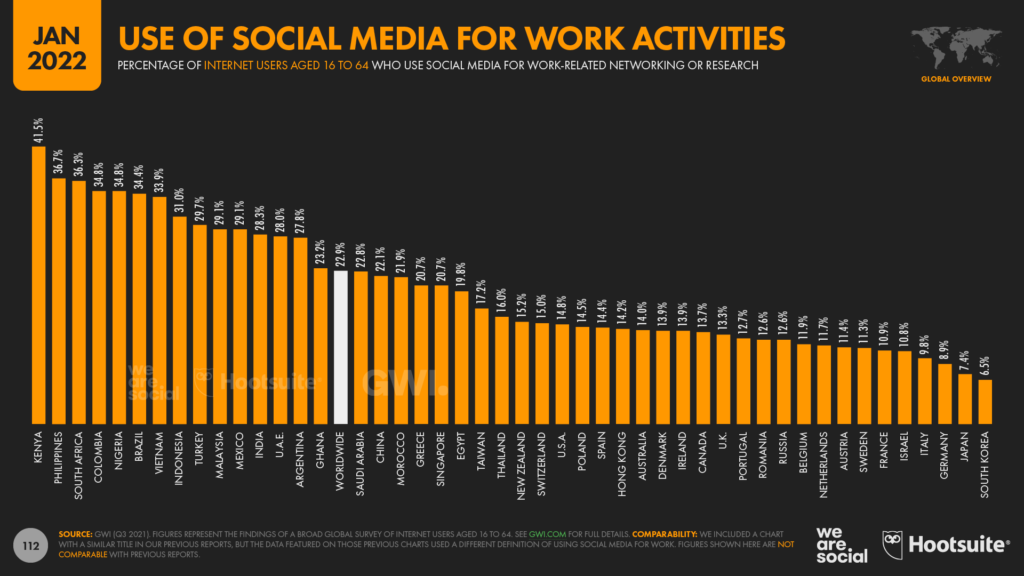
Social media for work GWI’s latest numbers show that almost 1 in 4 internet users aged 16 to 64 now uses social media for work-related activities.
However, this figure is considerably higher across many developing economies.
At the top of the scale, more than 4 in 10 working-age internet users in Kenya (41.5 percent) say that they use social media for work-related research.
Filipinos and South Africans are also considerably more likely to use social media for work than the global average, with more than one-third of internet users aged 16 to 64 in both countries saying that social media plays a role in their professional activities.
The median age of the overall population appears to play an important role in shaping how likely people in a particular country are to use social media for work, although it’s also worth noting that Greece seems to buck this trend.
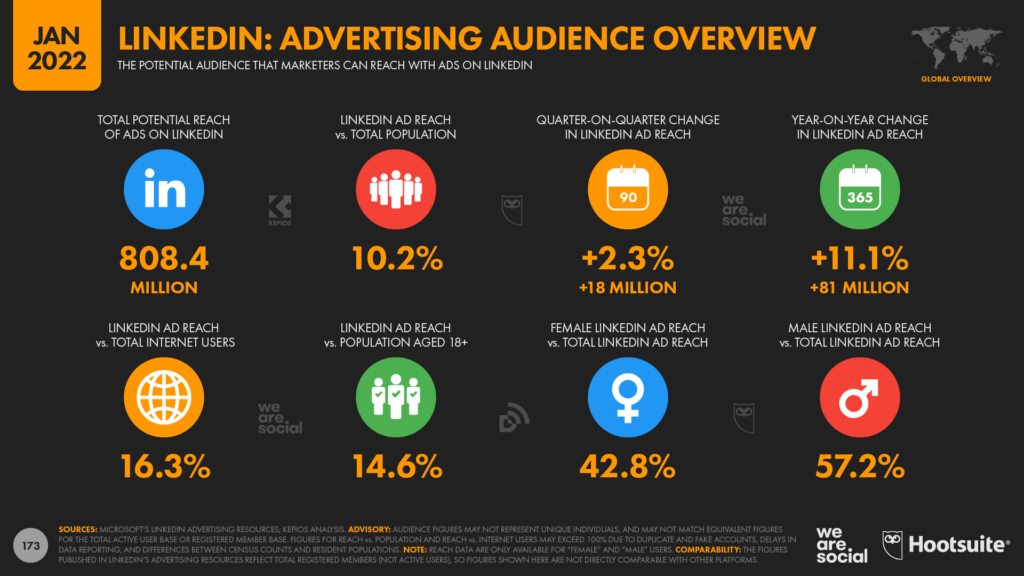
While we’re on the subject of professional social media, it’s also worth noting that LinkedIn has had another impressive year.
Our analysis of data published in the platform’s advertising resources reveals that LinkedIn’s registered member base has increased by 11 percent over the 12 months (+81 million members), taking the global total to more than 808 million by the start of 2022.
Dig deeper: we’ll be taking a closer look at how people use connected tech at work in our upcoming Digital 2022 April Global Statshot report, so look out for that towards the end of April.
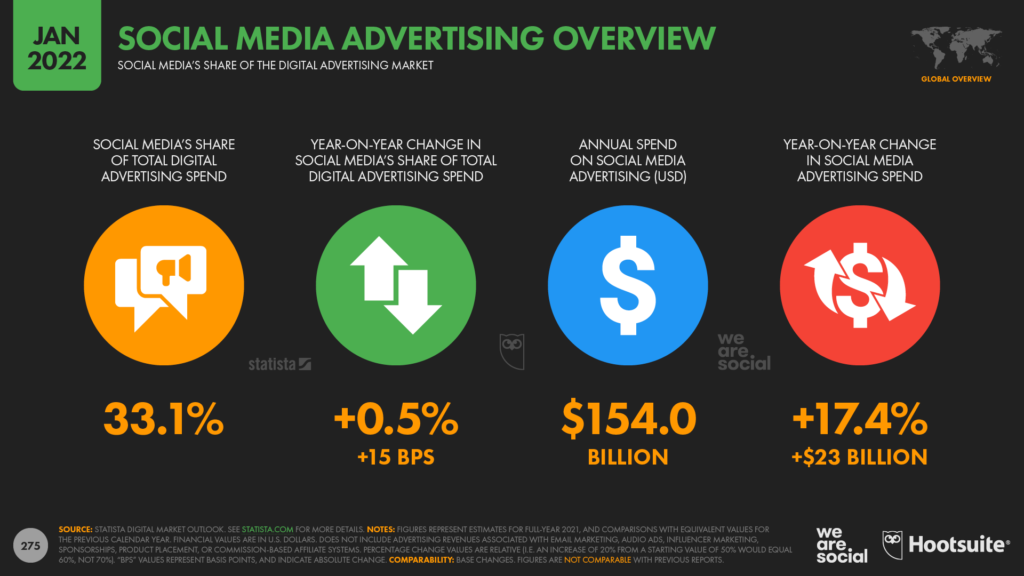
Big rise on social media ad spend Various data points in this year’s reports reveal that spending on social media ads has jumped significantly over the past 12 months.
For example, data from Statista shows that global social media ad spend exceeded USD $150 billion in 2021, with social media ads accounting for roughly one-third (33.1 percent) of total digital spend.
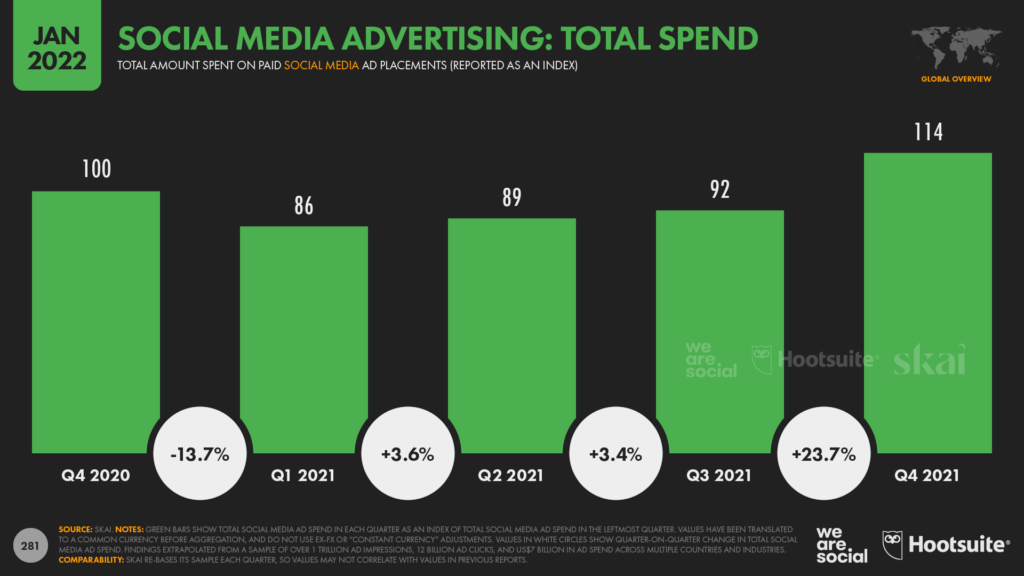
Meanwhile, the latest analysis from Skai shows that advertisers spent 14 percent more on social media ads in Q4 2021 than they did in the same quarter of 2020.
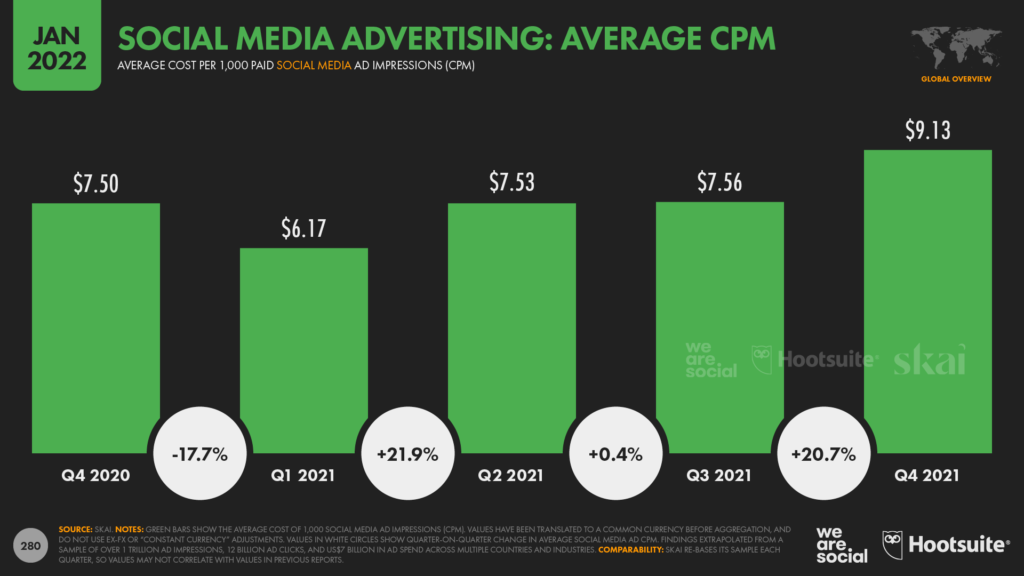
In line with this increase in overall spend, Q4 social media CPMs jumped by 21.7 percent year on year, with advertisers around the world paying an average of USD $9.13 for 1,000 social media ad impressions across the last 3 months of 2021.
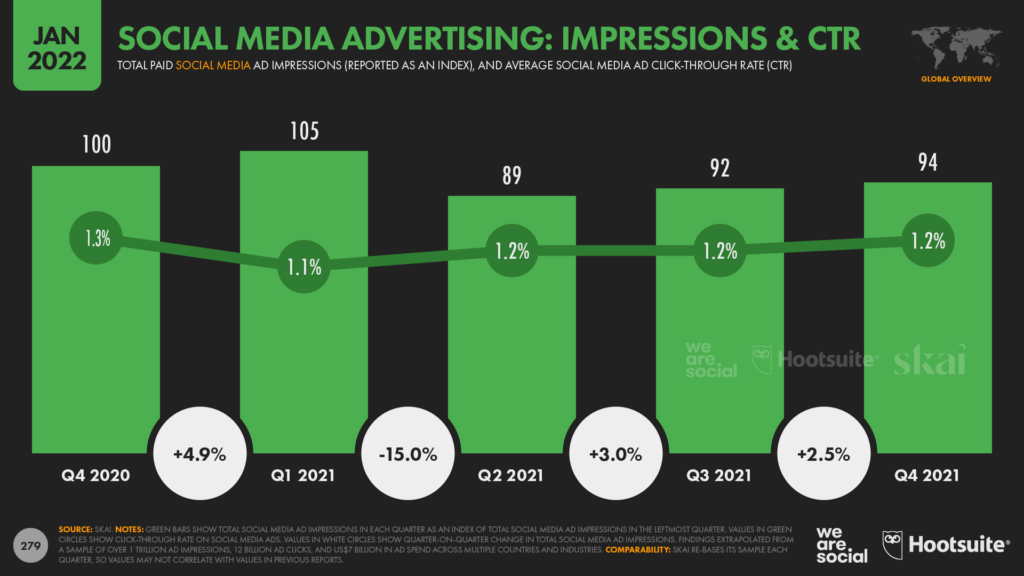
Crucially though, because of the higher average cost per impression, social media advertisers actually delivered fewer total impressions in Q4 2021 compared with the same period in 2020, despite spending more overall.
Related:click here to learn which social media platforms drive the greatest share of web traffic.
Social media’s role in the marketing mix Despite those rising ad costs, marketers will be reassured to learn that new research confirms the effectiveness of social media advertising.
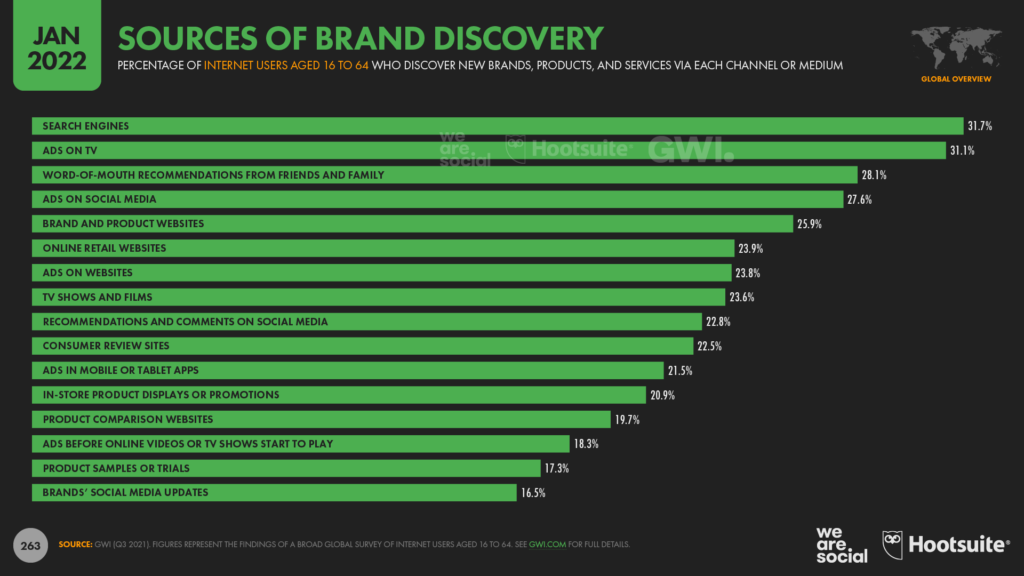
GWI’s latest data reveals that more than 1 in 4 internet users aged 16 to 64 (27.6 percent) discover new brands, products, and services via social media ads, which is only slightly less than the figure for TV ads (31.1 percent).
Search engines are still the top source of new brand discovery for the world’s internet users though, with 31.7 percent of GWI’s sample saying that they’ve learned about new brands via an online search.
Meanwhile, word-of-mouth recommendations also rank highly for brand discovery, so marketers may want to re-examine how easy it is for audiences to share their brand and its various online presences via messenger apps like WhatsApp and Telegram.
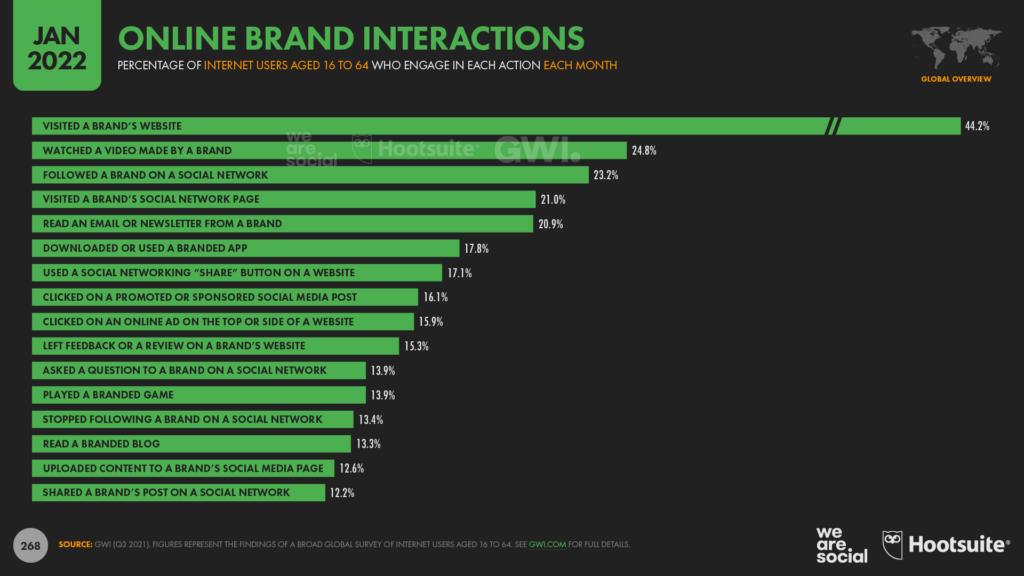
In addition to paid placements, it’s also worth noting that just under 1 in 4 working-age internet users (23.2 percent) actively likes or follows a brand on social media every month, while nearly 1 in 8 (12.2 percent) says that they (re)share brands’ social media posts at least once per month.
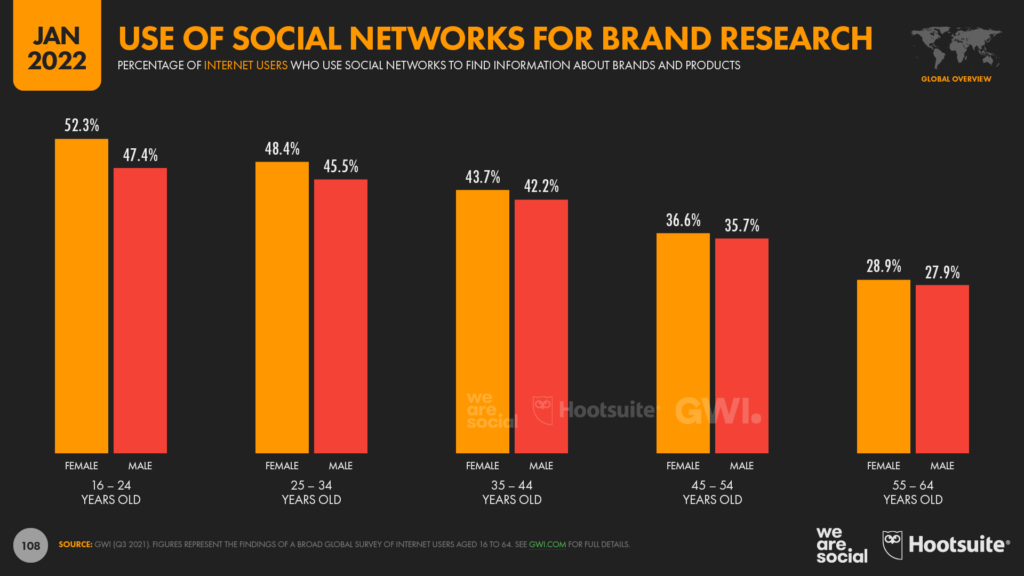
GWI’s research shows that brands’ social media activities play an important role at other stages in the purchase cycle too.
For example, more than 4 in 10 working-age internet users say that they visit social networks specifically to research brands and products that they’re thinking of buying, with this figure rising to half of all internet users aged 16 to 24.
But alongside all of these positive findings, there are also some more worrying trends in this year’s data.
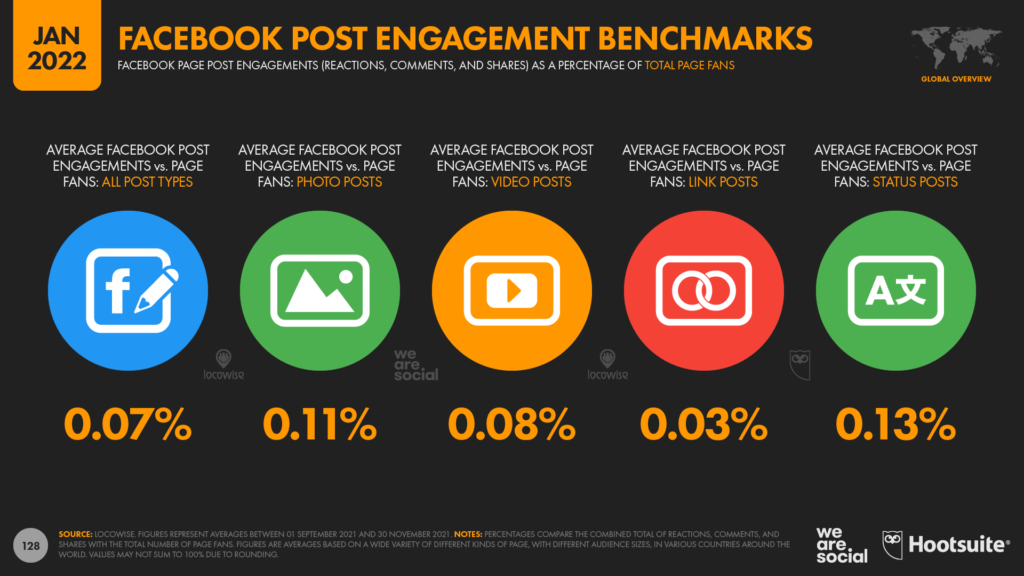
For example, the latest data from Locowise indicates that Facebook pages can now expect an average engagement rate of just 0.07 percent.
That means that – on average – just 7 fans in every 10,000 will react to, comment on, or share any given post.
And even more disturbingly, that average falls to just 0.05 percent for pages with more than 100,000 fans.
Related: explore insights into social media marketing effectiveness in Hootsuite’s Social Media Trends 2022 report.
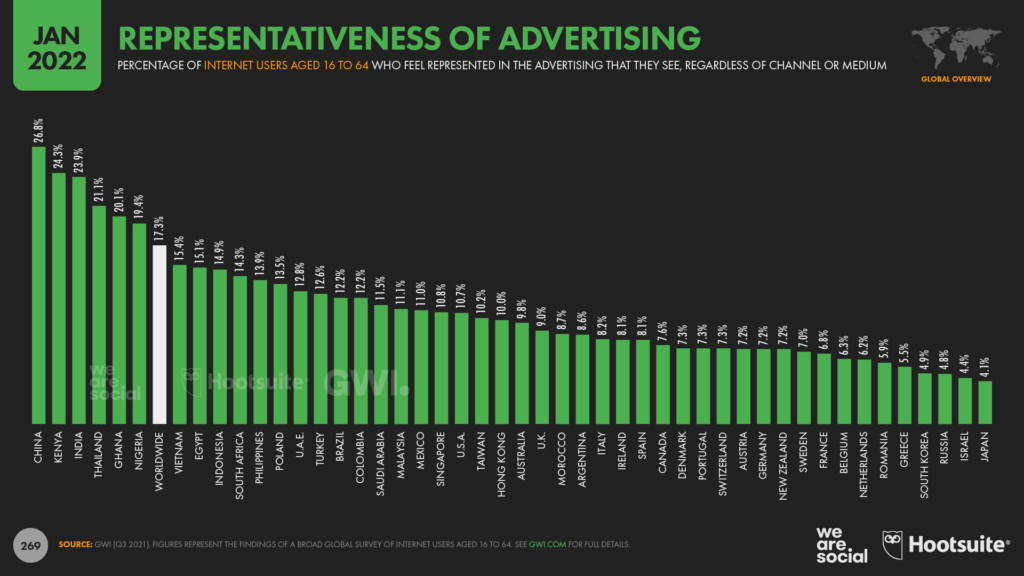
The representativeness of advertising Another troubling finding in this year’s data is that barely 1 in 6 working-age internet users (17.3 percent) says that they feel represented in the ads that they see, regardless of the advertising medium.
At the better end of the scale, GWI reports that people in China are the most likely to say that they feel represented in ads, with just over 1 in 4 (26.8 percent) answering in the affirmative.
However, just 1 in 9 Americans has a similar perspective, and the figure drops to just 1 in 11 for people in the UK.
Japan sits at the bottom of the rankings, with just 1 in 24 respondents in the country saying that they feel represented in the ads that they see – and this despite Japanese brands spending more than USD $47 billion on advertising in 2021.
However, this poor result may in part be due to Japan’s high median age.
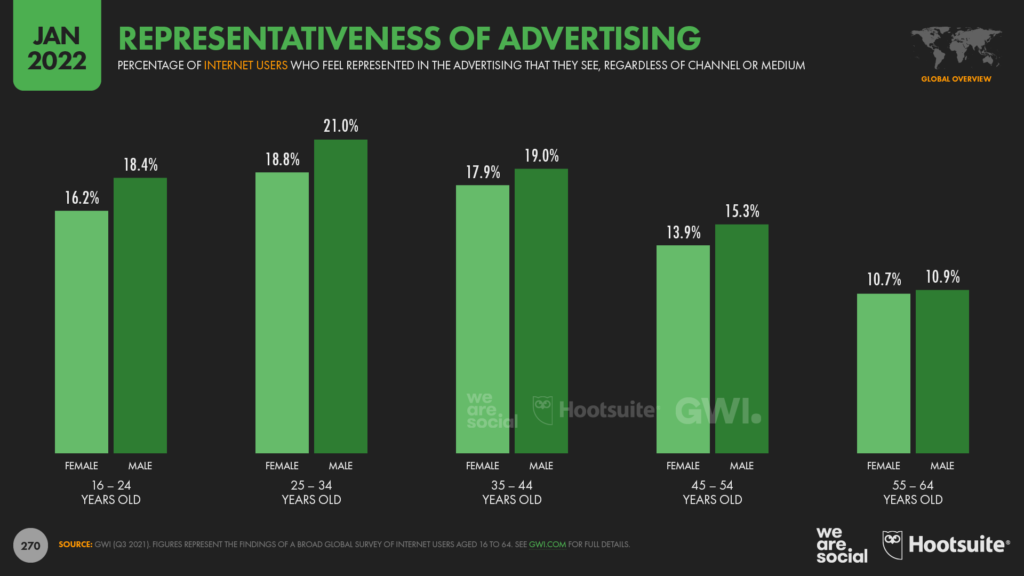
Indeed, GWI’s data highlight the fact that – all over the world – older people feel particularly detached from advertising, with just 1 in 9 global internet users aged 55 to 64 (10.8 percent) saying that they recognise themselves in the advertising that they see.
But therein lies one of the many challenges in interpreting and acting on this data.
Should advertising actually reflect the audience that it’s aimed at, or should it offer an alternative perspective (e.g. a more “aspirational” lifestyle)?
This is one of the more contentious questions in marketing, and – sadly – there are no simple answers.
The best advice I can offer is to invest both time and resources in understanding not only what your specific audience’s life looks like, but also in understanding people’s hopes, dreams, and fears.
Conventional research will be an invaluable tool here, and many of the data partners featured in this year’s reports will be able to help.
Similarly, while social listening may not make the media headlines it used to, I firmly believe that regular social listening can provide some of the most powerful insights into what people actually care about.
So, as you put the finishing touches to those 2022 plans, be sure to put aside some time and money for active exploration of what matters to your audiences, and what “ad representativeness” might look like on their terms.
Related: learn about the latest cultural themes shaping advertising effectiveness in We Are Social’s Think Forward 2022 report.
Ecommerce trends As we predicted in our Digital 2021 reports, the increases in ecommerce adoption that we’ve seen since the start of the COVID-19 pandemic show no signs of abating, even as movement restrictions come and go.
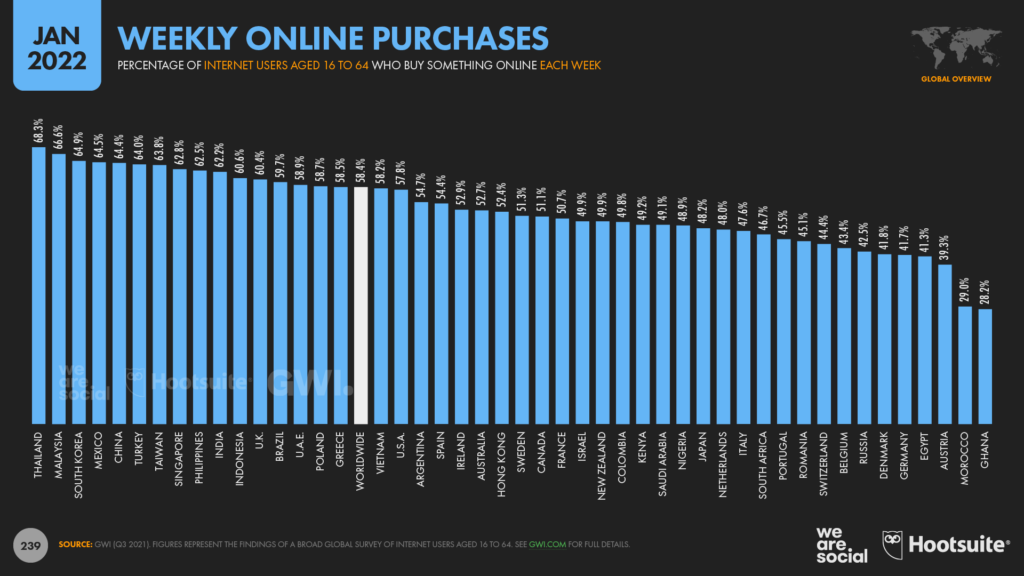
Data from GWI shows that nearly 6 in 10 working-age internet users (58.4 percent) now buy something online every week, with that figure continuing to rise throughout 2021.
Many of our lockdown-inspired behaviours have also endured, even as people venture back out into the world.
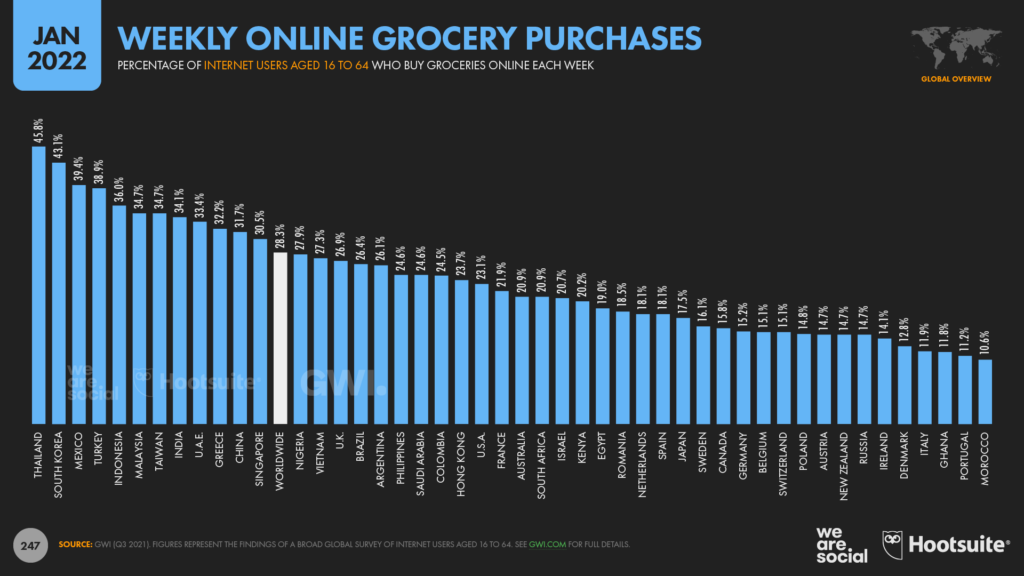
For example, almost 3 in 10 of us (28.3 percent) now buy groceries online every week, with the absolute number of online grocery shoppers increasing by 10 percent in just the past 6 months.
Meanwhile, spending in the grocery category has grown even faster than user numbers have.
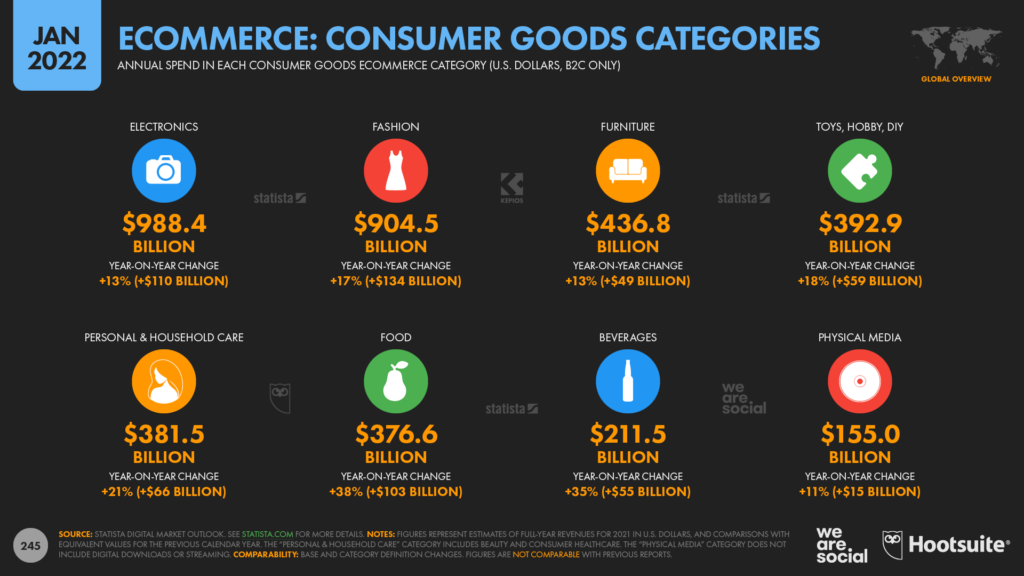
Figures in Statista’s Digital Market Outlook show that online spend in the the Food and Beverages categories grew by more than 35 percent during 2021, with total annual revenue across these two categories reaching $588 billion.
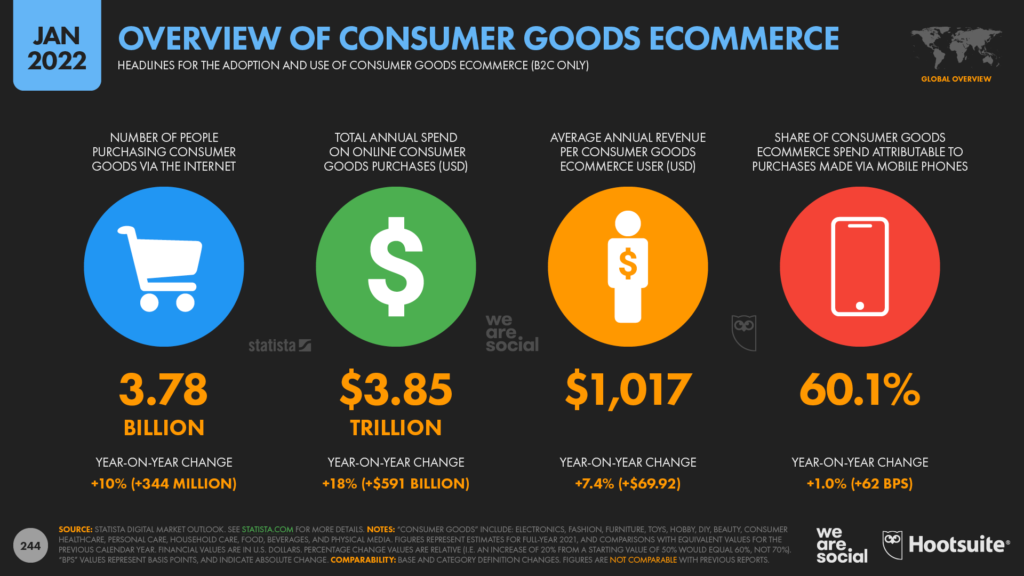
Overall, global revenues associated with online purchases of “consumer goods” – which include groceries, fashion, electronics, and other household items – increased by more than half a trillion US dollars during 2021 (+18 percent), reaching a total of USD $3.85 trillion for the year as a whole.
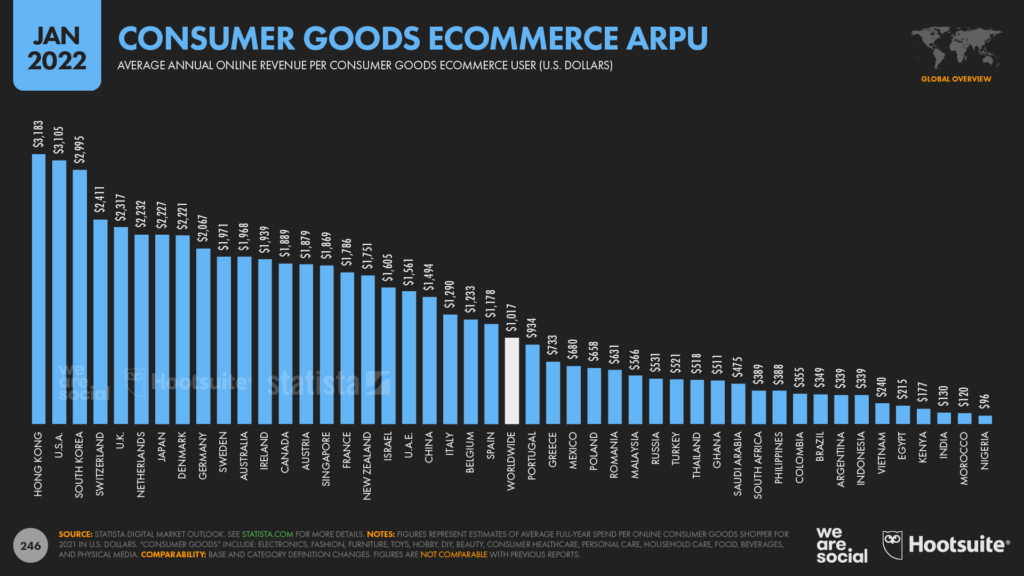
Statista’s data also reveals that the world’s ecommerce shoppers now spend an average of more than USD $1,000 per person, per year on online consumer goods purchases.
However, once again, the story varies considerably by geography.
Average revenue per user (ARPU) for online consumer goods purchases now exceeds USD $3,000 per year in Hong Kong and the United States, but remains below USD $100 in Nigeria.
There’s some more optimistic news for travel brands in this year’s data, too.
Online travel revenues remain considerably lower than they were in 2019, but consumer spending has increased steadily over the past 12 months.
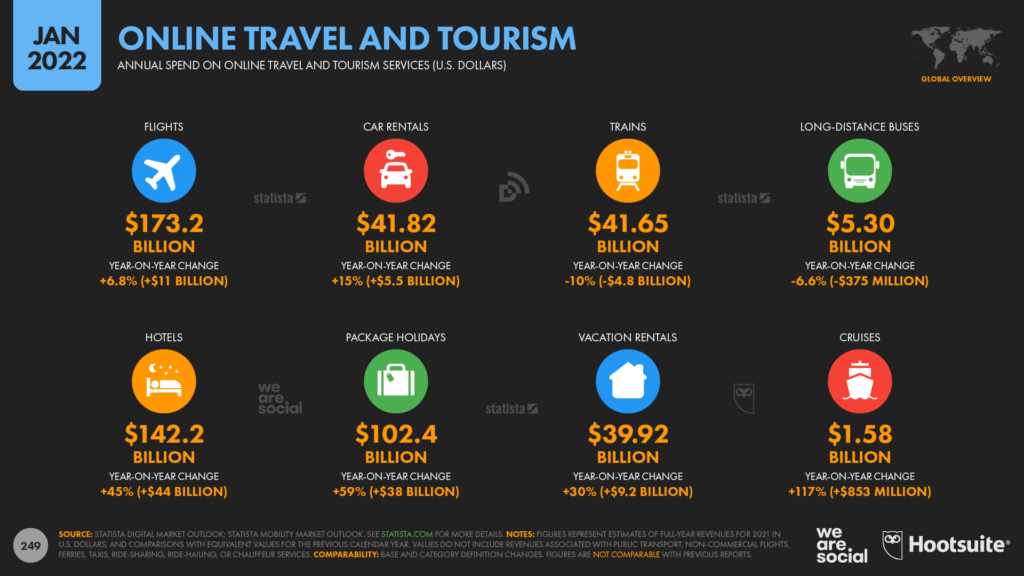
Statista’s Mobility Market Outlook reports that global online spend on flights grew by USD $11 billion (+6.8 percent) in 2021, reaching a total of USD $173 billion for the year.
The value of online hotel bookings has increased even faster though, with global revenues up by 45 percent compared with last year.
The world spent $142 billion on online hotel bookings in 2021, with annual revenues increasing by USD $44 billion compared with the overall total for 2020.
But the latest data also reveal that ecommerce isn’t just about getting “the latest and greatest”.
Research from GWI reveals that ‘recommerce’ is also an increasingly popular choice, with 1 in 7 internet users aged 16 to 64 (14.4 percent) buying a used or second-hand item online each week.Additional data: for a comprehensive look at the latest ecommerce stats and trends, check out Shopify’s excellent new Future of Commerce reports, which our Global Digital Reports team also contributed to.
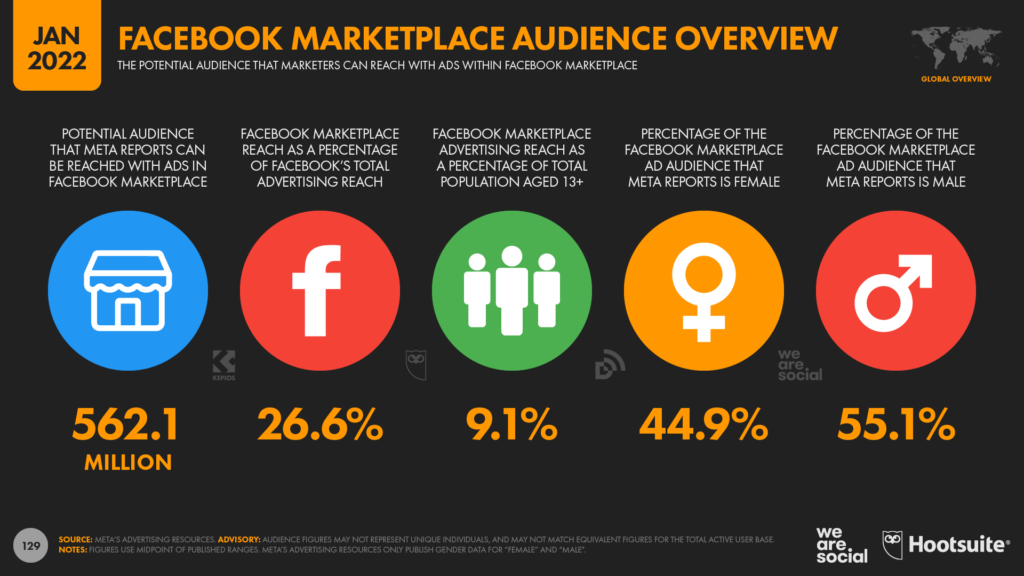
Social commerce takes off New additions to this year’s reports include figures for ad reach on Facebook Marketplace and Instagram Shop.
These figures only represent the number of users that marketers can reach with ads in these environments, and they may not represent the full extent of each environment’s total active user base.
Indeed, Meta reports that more than 1 billion Facebook users access Marketplace each month, so there seems to be quite a big gap between total Marketplace users, and the share of those users that sees ads within Facebook’s commerce environment.
However, this gap exists across other Meta products too, and our analysis suggests that Facebook’s overall ad reach only equates to about 72 percent of the platform’s total monthly active user figure [find some potential explanations here].
What’s more, these Marketplace and Instagram Shop figures still tell a compelling story, and further demonstrate that social commerce has already gained rapid momentum.
For example, ads in Facebook Marketplace now reach more than 560 million users each month, equating to more than a quarter of the platform’s total ad reach.
In line with overall platform demographics, Facebook Marketplace attracts a larger male audience, with men accounting for 55 percent of the Marketplace audience.
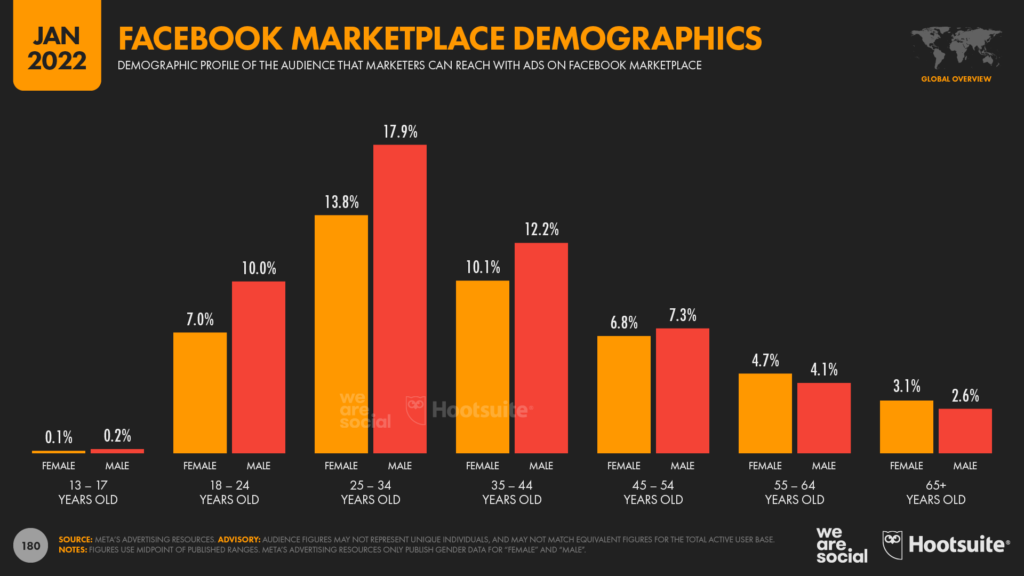
However, the more interesting finding is that the Marketplace audience tends to be considerably older than the Facebook audience as a whole.
Users over the age of 35 account for more than half (50.9 percent) of Marketplace’s global ad audience, yet they account for just 40.9 percent of Facebook’s overall ad audience.
Note that Facebook limits use of Marketplace to users aged 18 and above, which explains why figures in the lowest age bracket are so low.
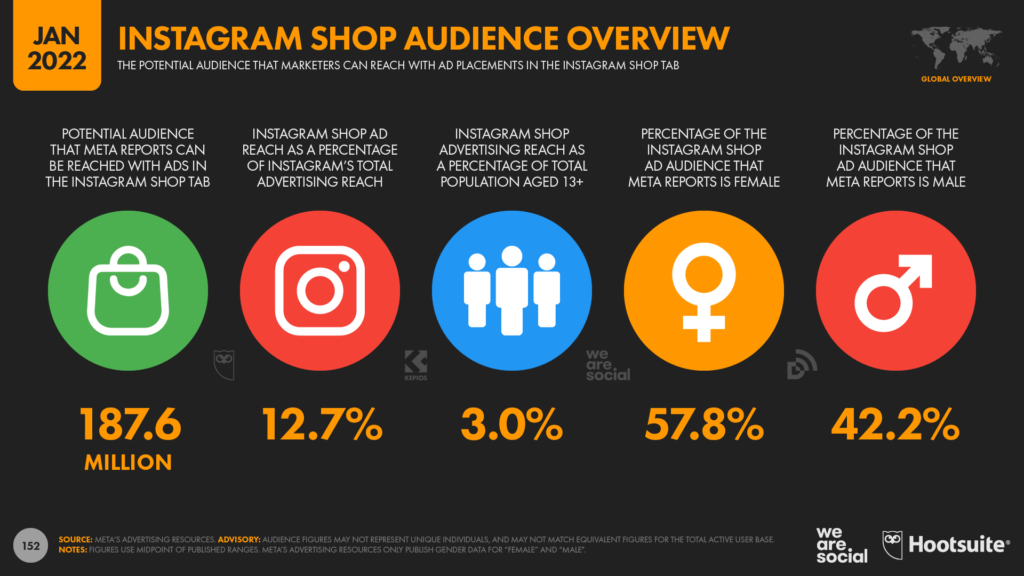
Instagram Shop has also started to gain momentum, with Meta’s tools reporting that advertisers can now reach more than 187 million users with ads in the Shop tab each month.
However, in contrast to the findings for Marketplace above, the data indicate that women account for a much greater share of Instagram Shop’s global ad audience.
Related: could social commerce help Meta build an alternative to its ad-funded model? Learn more in our detailed analysis.
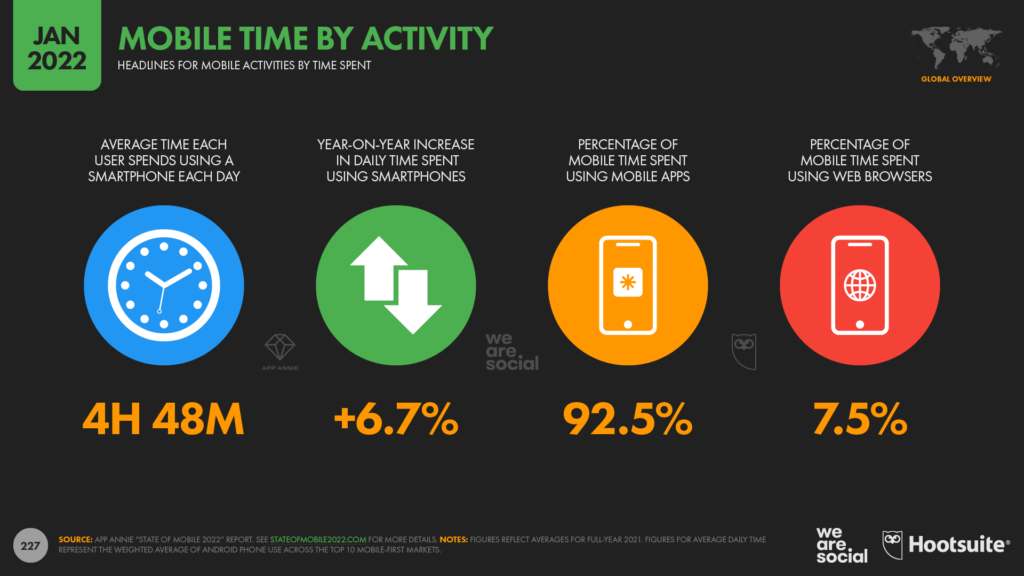
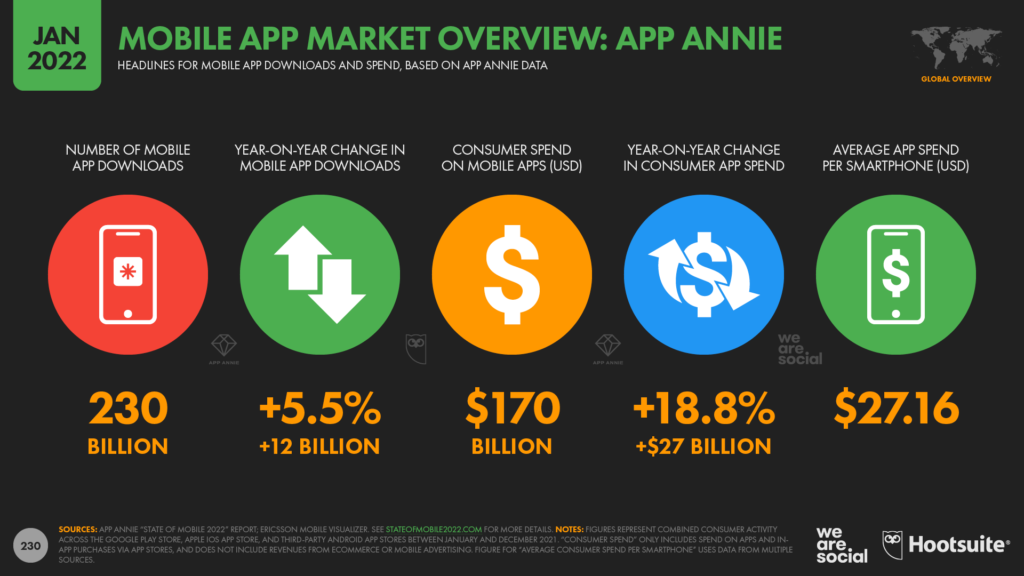
Mobile apps are a serious business App Annie’s new State of Mobile 2022 report reveals that the typical mobile user now spends an average of 4 hours and 48 minutes per user, per day using their phone.
That means that the world’s 5.3 billion mobile users will spend more than 1 billion years of combined human time using mobile phones in 2022.
And all that time adds up to serious money, too.
In addition to the handset revenues that helped to propel Apple Inc. to a USD $3 trillion market cap earlier this month, the world’s smartphone users spent a combined total of USD $170 billion on mobile apps and in-app purchases in 2021.
Based on Ericsson’s latest figures for the number of handsets in use around the world, that equates to an average of more than USD $27 per handset.
That may not sound like a huge amount, but to put those figures in context, worldwide consumer spend on mobile apps now equates to roughly 0.2 percent of total global GDP.
What’s more, these revenue figures only include transactions made directly through app stores, and don’t include things like ecommerce purchases made via mobile apps, or mobile ad revenues.
Consumer spending on apps continues to increase too, with 2021 revenue increasing by almost 19 percent compared with the total for 2020.
Additional data: find more great mobile insights in App Annie’s excellent State of Mobile 2022 report.
Mobile connections accelerate
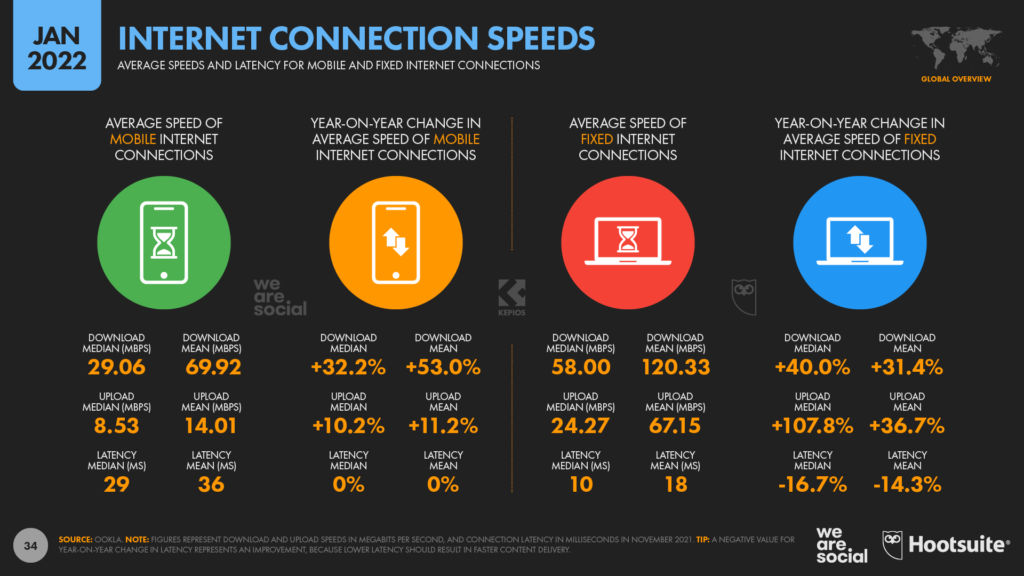
And in more good news for the mobile economy, cellular data connection speeds also continue to accelerate.
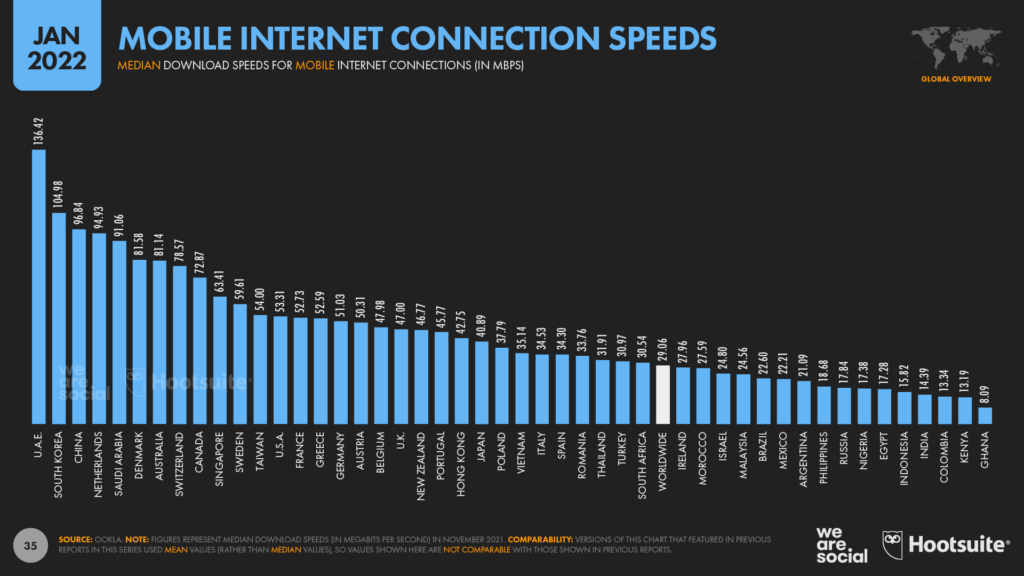
Analysis from Ookla reveals that the median worldwide download speed via mobile connections increased by roughly a third over the past year, and more than half of the world’s mobile internet users now enjoy data connection speeds in excess of 29 megabits per second (Mbps).
For context, 29 Mbps is more than fast enough to stream a 4K video without any buffering.
Note that Ookla recently changed its focus from mean speeds to median speeds though (click here to understand the difference), so these latest numbers aren’t directly comparable to the figures we featured in previous reports.
However, this change in metrics doesn’t detract from the overall story: mobile connections are getting much faster, much more quickly.
This trend will be of particular interest to futurists, because faster mobile data speeds may also help to accelerate developers’ ability to deliver engaging AR, VR, and broader metaverse experiences via mobile connections.
Dig deeper: read our complete analysis of mobile and fixed connections speeds by clicking here.
Related: make sense of today’s mobile internet landscape with the help of GSMA Intelligence’s State of Mobile Internet Connectivity report.
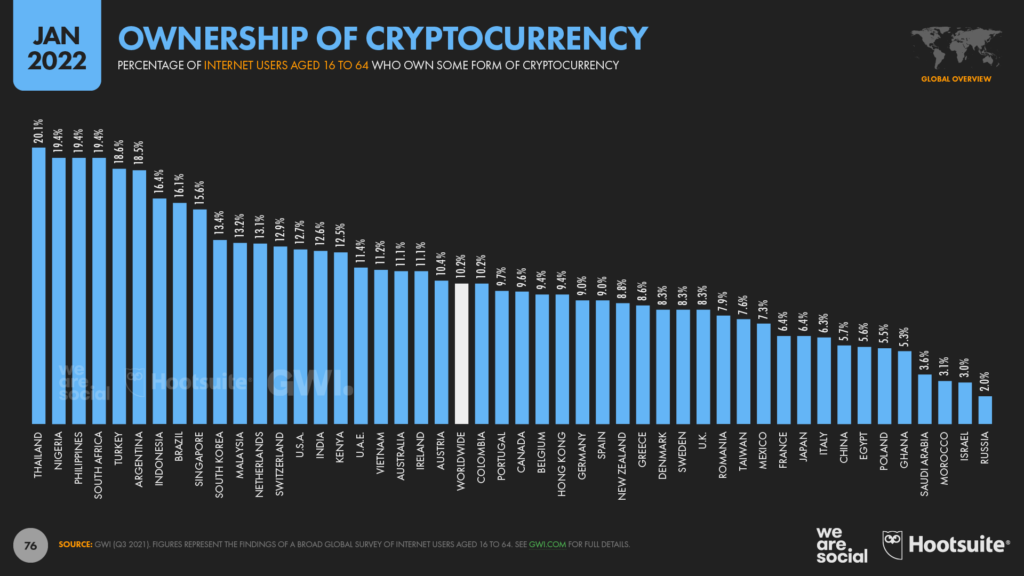
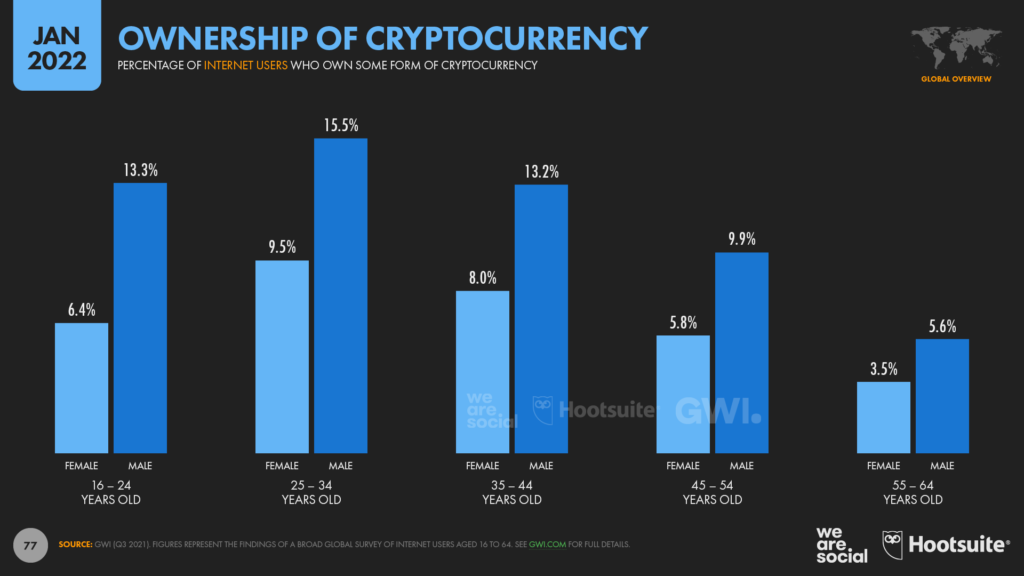
Cryptocurrencies catch on The number of people who own cryptocurrencies has jumped by more than a third (+37.8 percent) since this time last year.
GWI reports that more than 1 in 10 working-age internet users now owns some form of cryptocurrency, with that figure rising to more than 2 in 10 in Thailand.
Cryptocurrencies are particularly popular across developing economies, especially in countries where conventional currencies are more prone to big fluctuations in exchange rates.
For example, in Turkey – where the local lira has lost roughly half of its value versus the US dollar over the past year – ownership of cryptocurrencies has almost doubled (+86 percent) in the past twelve months, from 10 percent to 18.6 percent.
However, “crypto” ownership is still heavily male skewed, and older audiences are also underrepresented.
Fewer than 1 in 20 internet users aged 55 to 64 owns any cryptocurrency today, and this finding may have important implications for policy makers exploring the potential for digital currencies.
Dig deeper: learn more about cryptocurrency trends in GWI’s excellent Connecting the Dots report.
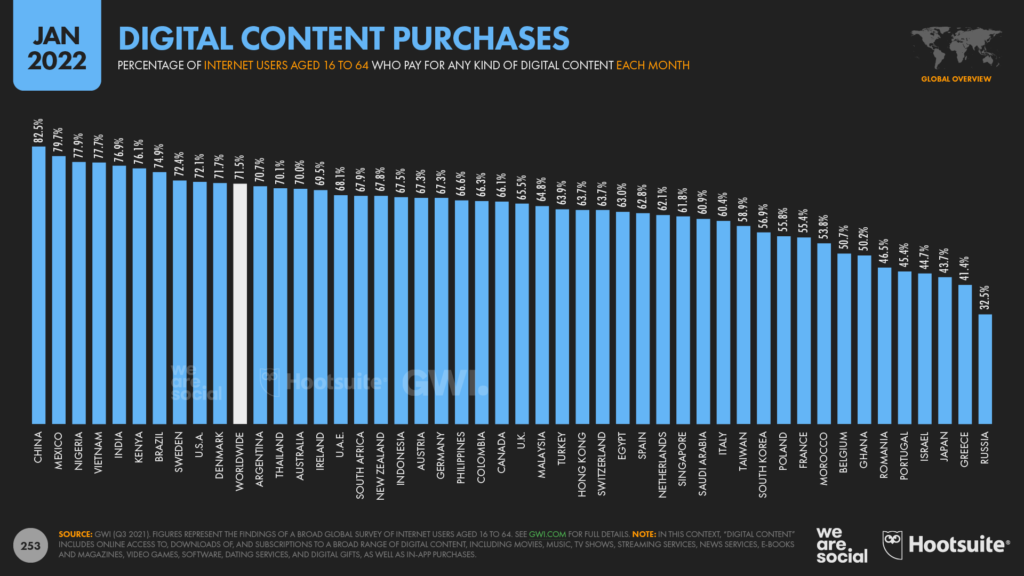
Most people pay for digital content Contrary to stereotypes, the world’s internet users are not averse to paying for digital content.
GWI finds that more than 7 in 10 working-age internet users (71.5 percent) now pay for some form of digital content each month, with that figure rising to almost 8 in 10 amongst younger Millennials.
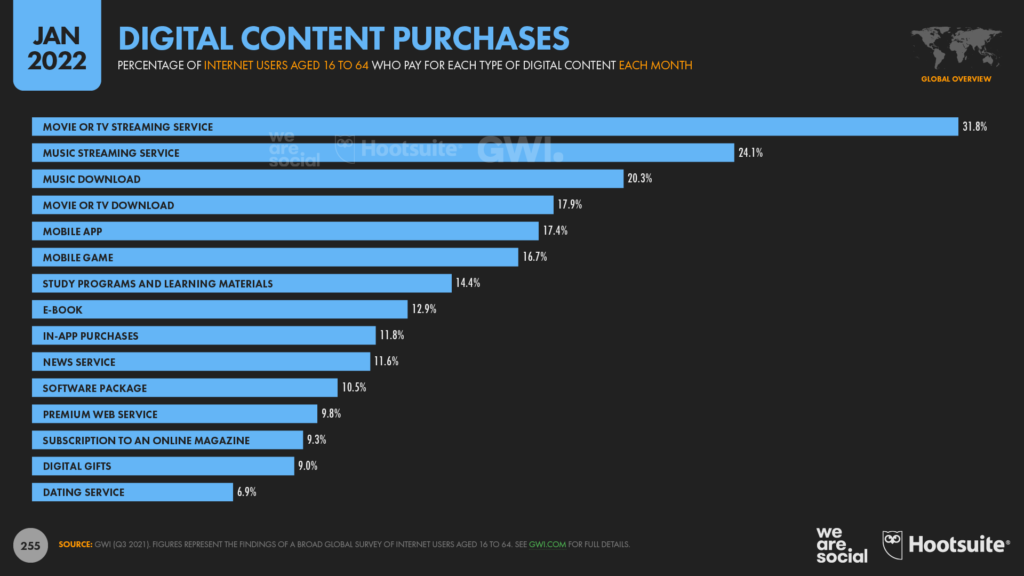
Perhaps unsurprisingly given the rapid rise of platforms like Netflix and Spotify, TV and music streaming subscriptions are the most popular forms of paid digital content.
However, people still pay for downloads too, with more than 1 in 5 internet users saying that they’ve paid to download music within the past 30 days.
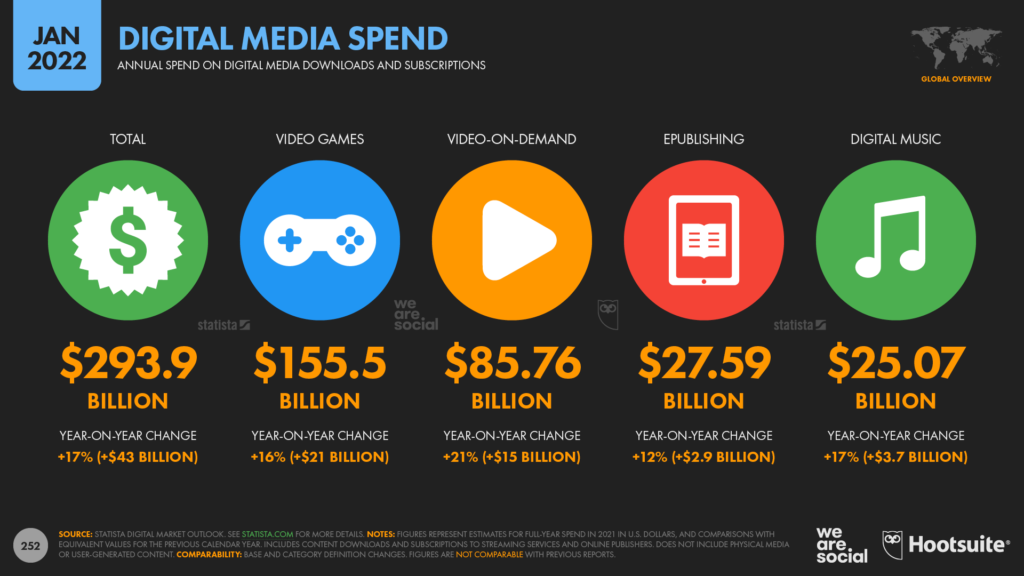
In total, Statista reports that the world’s internet users spent almost USD $300 billion on digital content in 2021.
Interestingly though, despite the popularity of video and music streaming platforms, spend on video games accounted for more than half of that global total, highlighting just how valuable the gaming audience remains.
Related: explore the rise of cross-cultural content in our in-depth analysis.
Looking ahead: Digital 2022 That’s almost all for my analysis of this year’s Global Overview Report, but here are a few things to look out for over the coming months:
We should pass the momentous 5 billion internet user milestone in time for our next quarterly Statshot report. To celebrate, we’ll offer a bumper collection of insights into how the internet impacts daily lives around the world, so be sure to check back for that analysis in late April.
We may see some turbulence in the world of decentralised finance (DeFi) over the next few months, with the value of cryptocurrencies continuing their wild swings. Moreover, with ever more people investing in these “alternative” financial instruments, we can expect calls for greater regulation, more stringent government oversight, and – almost inevitably – new forms of taxation.
At the same time, while the underlying tech is undoubtedly here to stay, people will come to realise that NFTs are nothing more than certificates of digital ownership, and – ultimately – it’s the assets they represent that determine their actual value. As a result, I hope we’ll see the NFT conversation shift away from irrational speculation, and put greater emphasis on helping the world’s creators derive enduring value from their hard work.
Following the success of Squid Game, Money Heist, and Lupin, expect the unexpected when it comes to digitally distributed culture. Streaming platforms make it easier than ever for great content to travel around the world in an instant, fuelled by the social media water-cooler and ever more accurate algorithms. As a result, tomorrow’s big hits are just as likely to come from Hanoi and Harare as they are to come from Hollywood.
We’ll start to see greater convergence across digital activities, with formats like Live Commerce blending the best of social media, entertainment, and online shopping. Similarly, as faster mobile connections and more powerful mobile devices become ever more accessible, we can expect more immersive content experiences. In particular, I’m expecting to see AR find its way into rich music ‘experiences’ (well beyond music videos), while a handful of brands will also move beyond hype and hot air to deliver some truly compelling experiences in online virtual worlds.
Hopefully that’s given you more than enough to think about, but just in case you’re already craving your next fix of facts and figures, you might like to know that I’ll be back in a couple of weeks with the first of our Digital 2022 local country reports, which we’ll start publishing in mid-February.
And finally… I suspect you’ve only made it this far because you’re anxious to find the latest updates in one of our most thought-provoking datasets, so I won’t leave you disappointed.
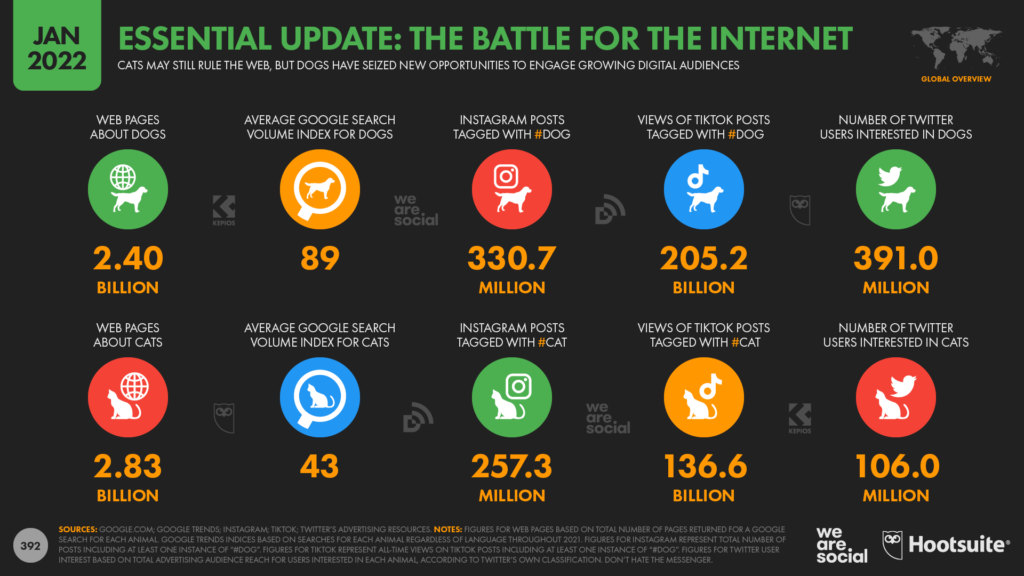
Regular readers will be pleased to hear that the battle for the internet continues, but – for the third year in a row – data suggests that dogs may once again have had the upper hand paw in 2021.
To date, users have published more than 330 million posts to Instagram tagged with #dog, compared with just 257 million posts tagged with #cat.
These figures reveal that Instagram has seen an impressive 38 million new #dog posts since our 2021 report, but just 27 million new posts for #cat.
However, canines’ dogged success over the past year isn’t just down to the #dogsofinstagram.
A similar pattern has played out on TikTok, where #dog posts now exceed 205 million, compared to just 137 million for #cat posts.
In a more encouraging finding for the felines, Twitter users appear to have become a little less extreme in their animal views over the past year, but dog lovers still outnumber cat lovers on the platform by a factor of almost 4 to 1.
Dogs are clearly more salient in the zeitgeist too, with Google Trends data revealing that the world’s internet users searched for dogs twice as often as they searched for cats during 2021.
However, despite these valiant canine capers, cats still rule the web: Google returns more than 2.83 billion pages for “cat” today, compared with just 2.4 billion for “dog”.